# load packages
library(tidyverse)
library(scico)

# set theme for ggplot2
ggplot2::theme_set(ggplot2::theme_minimal(base_size = 14))

# set width of code output
options(width = 65)

# set figure parameters for knitr
knitr::opts_chunk$set(
  fig.width = 7, # 7" width
  fig.asp = 0.618, # the golden ratio
  fig.retina = 3, # dpi multiplier for displaying HTML output on retina
  fig.align = "center", # center align figures
  dpi = 300 # higher dpi, sharper image
)Generative art
Lecture 27
University of Arizona
INFO 526 - Spring 2024
Projects presentations
Any questions / things I can clarify about the projects or anything else we have covered so far?
Generative art
Setup
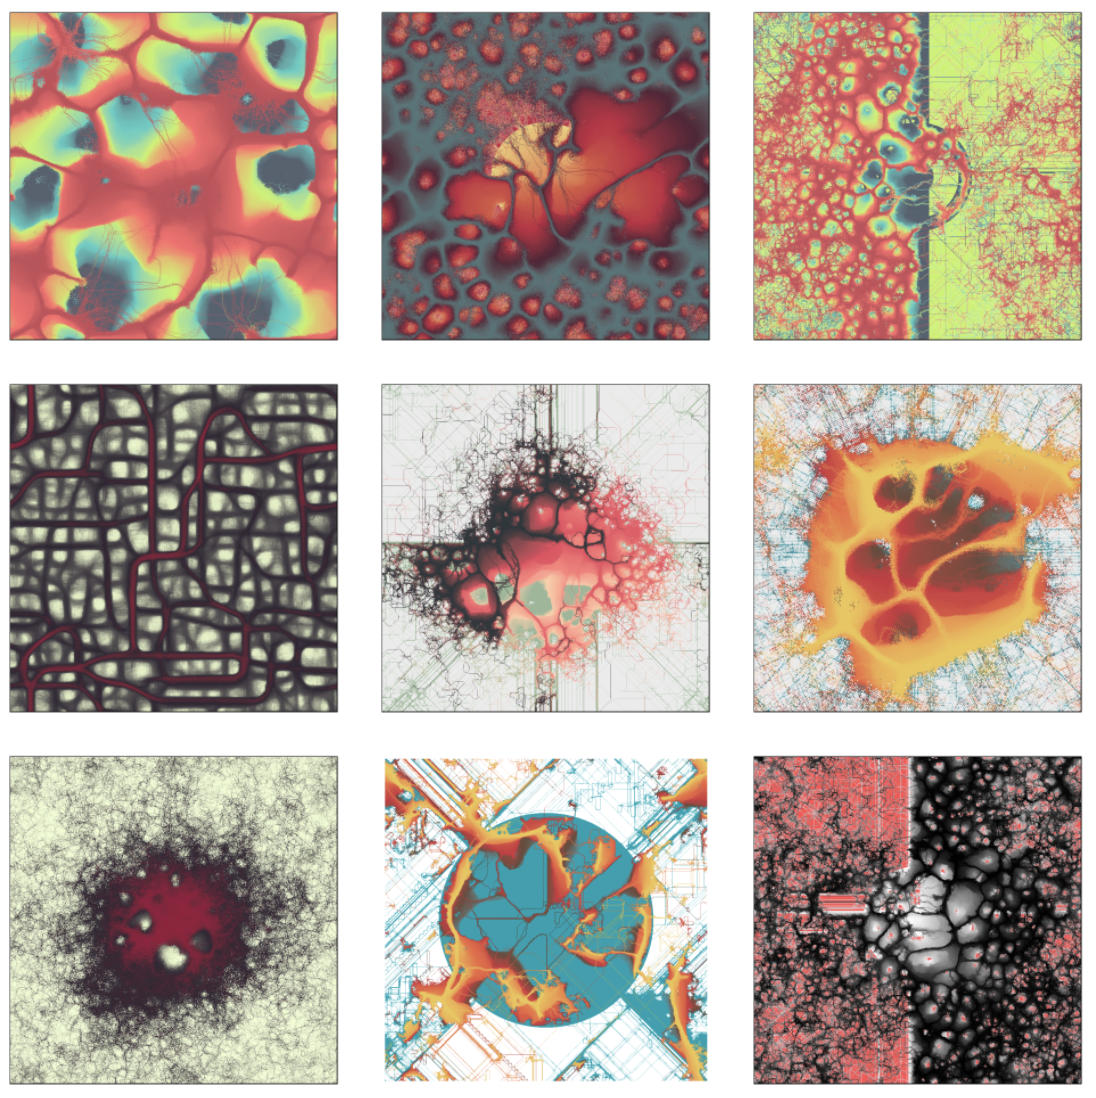
Genesis 338
by Thomas Lin Pedersen

Flametree
by Danielle Navarro

Permutations
by Georgios Karamanis
Abstractions
by Antonio Sánchez Chinchón
Generative art: what
One overly simple but useful definition is that generative art is art programmed using a computer that intentionally introduces randomness as part of its creation process.
- There is randomness to the art, introduced by the computer (the code)
- The artist has control over the randomness, as contradictory as that may sound
Generative art: why
- Why people create generative art pieces?
- Artistic expression
- Leveraging computers to generate randomness
- …
- Why are we learning about generative art?
- A different look at data visualization: not for the meaning in the data, but for the visual itself
- Great way to practice programming, particularly if you’re into creating art
- Opportunity to practice problem solving skills, particularly if you’re sketching first, then creating or reproducing an existing piece
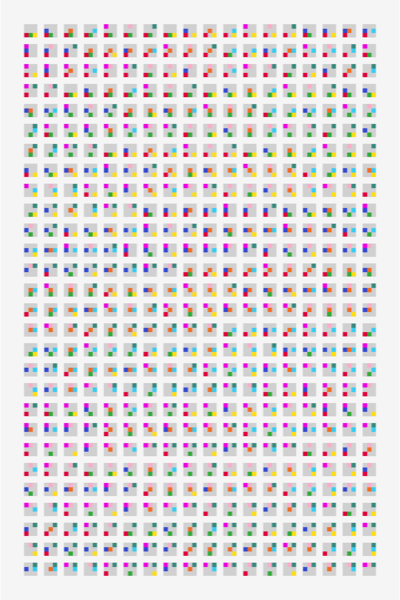
Generative art in use: Book covers
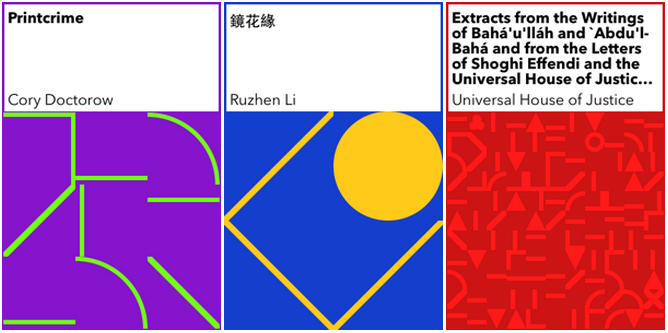
Just one of many examples of generative art as a practical solution by the New York Public Library:
To fill in missing book covers in an ebook-borrowing and reading app
I can plot myself flowers

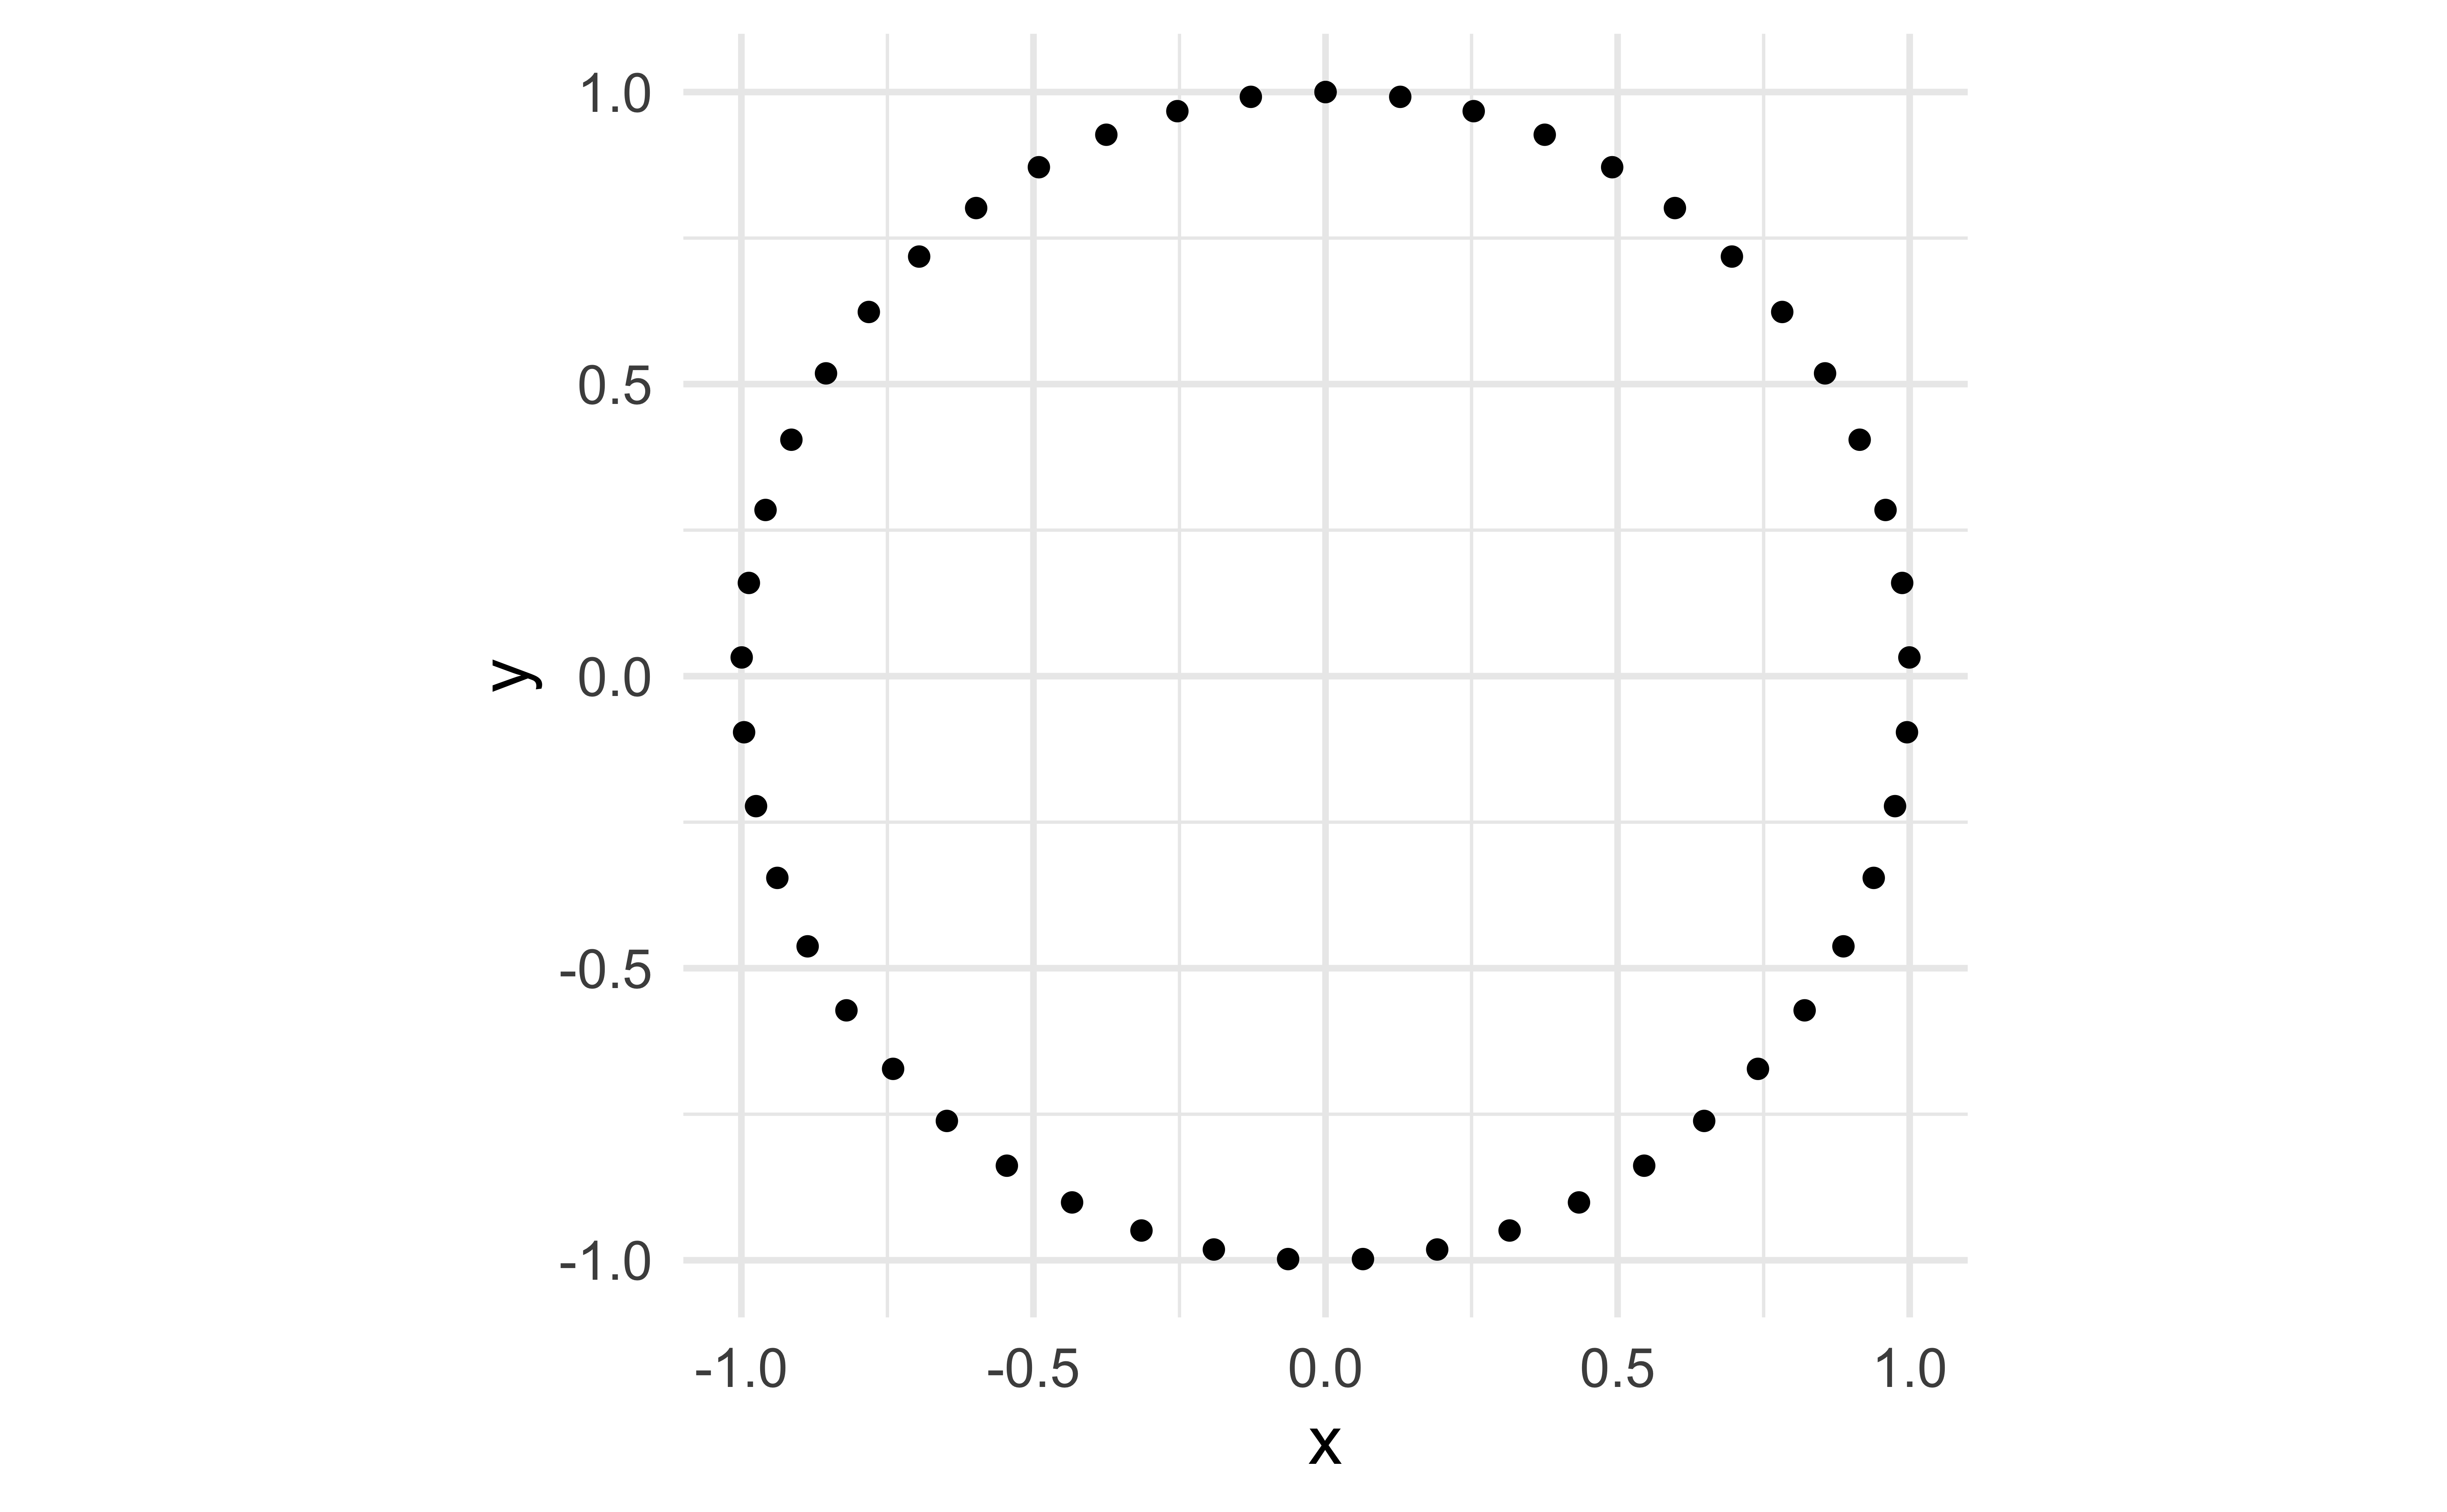
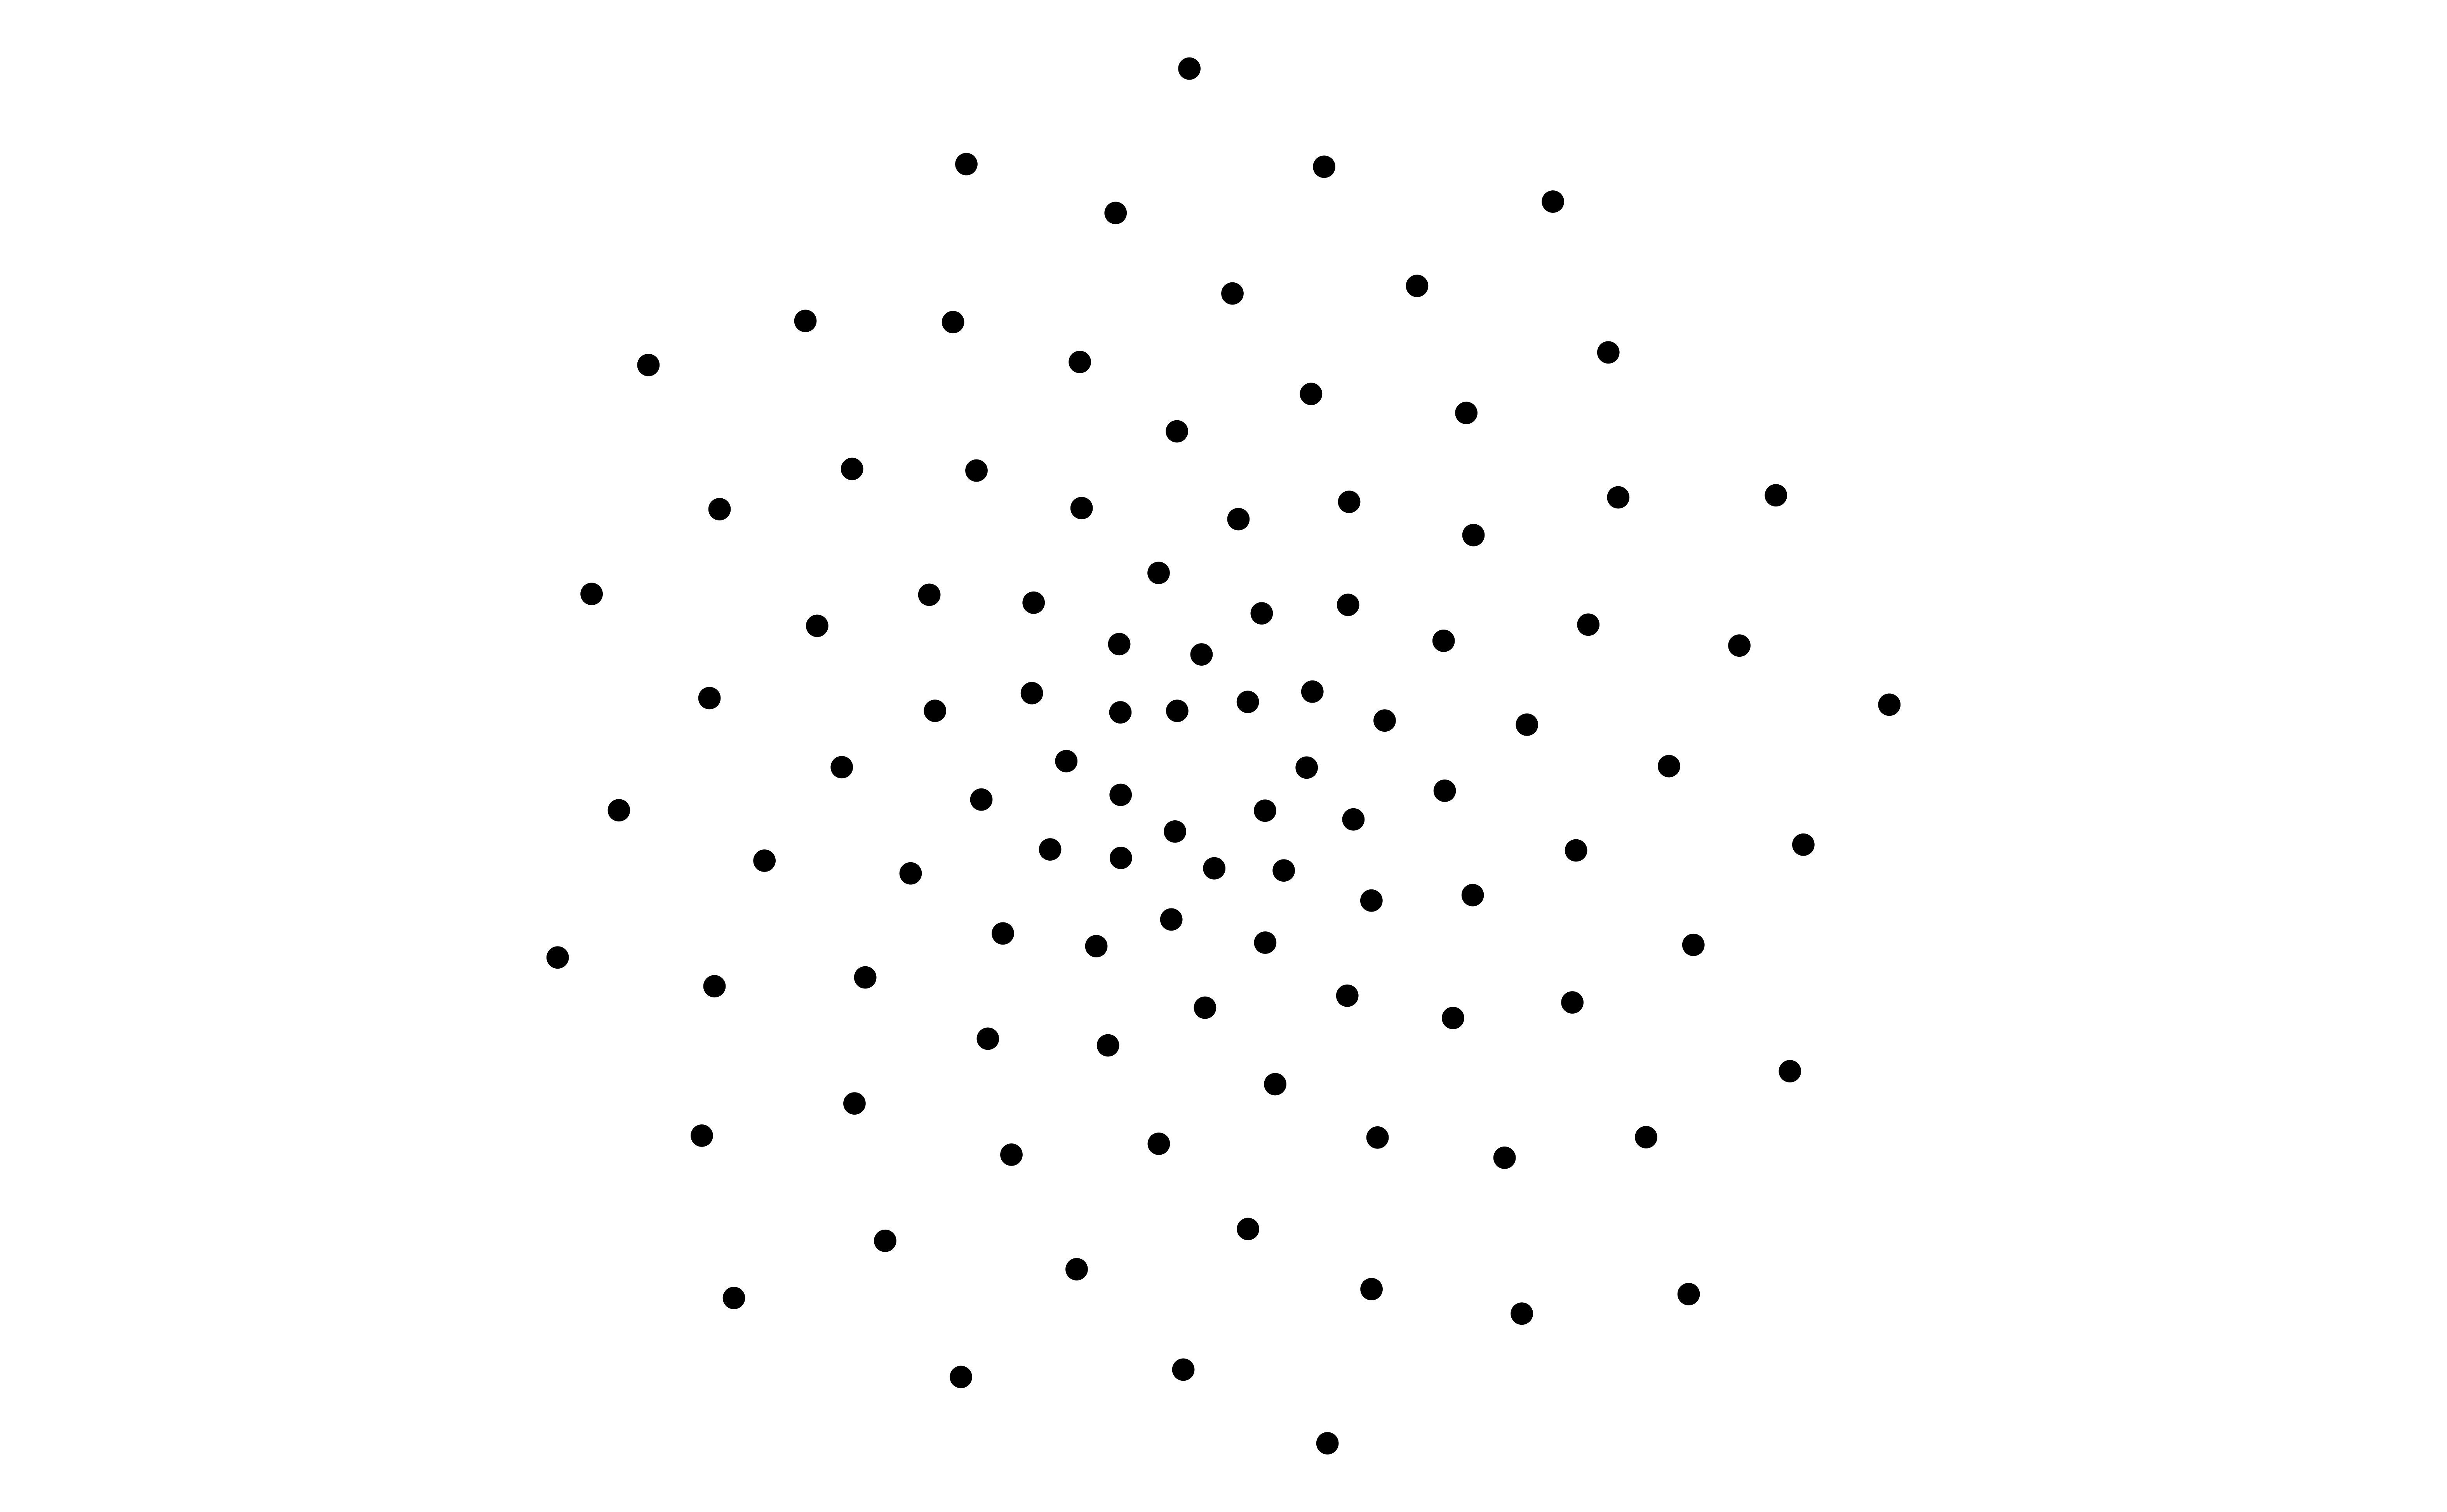
Let’s make a circle
The Golden Angle
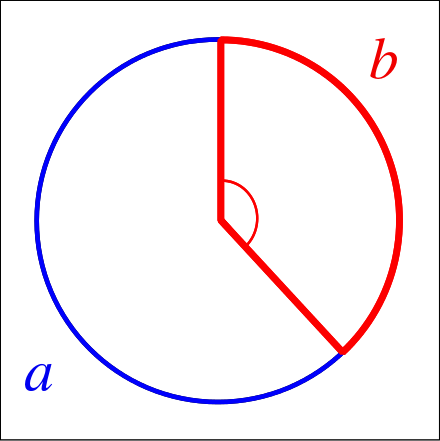
The golden angle is the angle subtended by the smaller (red) arc when two arcs that make up a circle are in the golden ratio.
π(3−√5)
The golden angle is the angle separating successive florets on a sunflower.
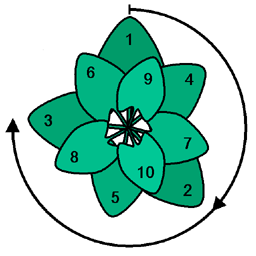
Petals with the golden angle
# set golden angle
angle <- pi * (3 - sqrt(5))

# set number of points
points <- 50

# make data frame
df <- tibble(
  i = 1:points,
  t = (1:points) * angle,
  x = sin(t),
  y = cos(t)
)

# plot points in a spiral
ggplot(df, aes(x = x * t, y = y * t)) +
  geom_path(color = "gray") +
  geom_text(aes(label = i)) +
  coord_equal()# set golden angle
angle <- pi * (3 - sqrt(5))

# set number of points
points <- 50

# make data frame
df <- tibble(
  i = 1:points,
  t = (1:points) * angle,
  x = sin(t),
  y = cos(t)
)

# plot points in a spiral
ggplot(df, aes(x = x * t, y = y * t)) +
  geom_path(color = "gray") +
  geom_text(aes(label = i)) +
  coord_equal()# set golden angle
angle <- pi * (3 - sqrt(5))

# set number of points
points <- 50

# make data frame
df <- tibble(
  i = 1:points,
  t = (1:points) * angle,
  x = sin(t),
  y = cos(t)
)

# plot points in a spiral
ggplot(df, aes(x = x * t, y = y * t)) +
  geom_path(color = "gray") +
  geom_text(aes(label = i)) +
  coord_equal()# set golden angle
angle <- pi * (3 - sqrt(5))

# set number of points
points <- 50

# make data frame
df <- tibble(
  i = 1:points,
  t = (1:points) * angle,
  x = sin(t),
  y = cos(t)
)

# plot points in a spiral
ggplot(df, aes(x = x * t, y = y * t)) +
  geom_path(color = "gray") +
  geom_text(aes(label = i)) +
  coord_equal()# set golden angle
angle <- pi * (3 - sqrt(5))

# set number of points
points <- 50

# make data frame
df <- tibble(
  i = 1:points,
  t = (1:points) * angle,
  x = sin(t),
  y = cos(t)
)

# plot points in a spiral
ggplot(df, aes(x = x * t, y = y * t)) +
  geom_path(color = "gray") +
  geom_text(aes(label = i)) +
  coord_equal()
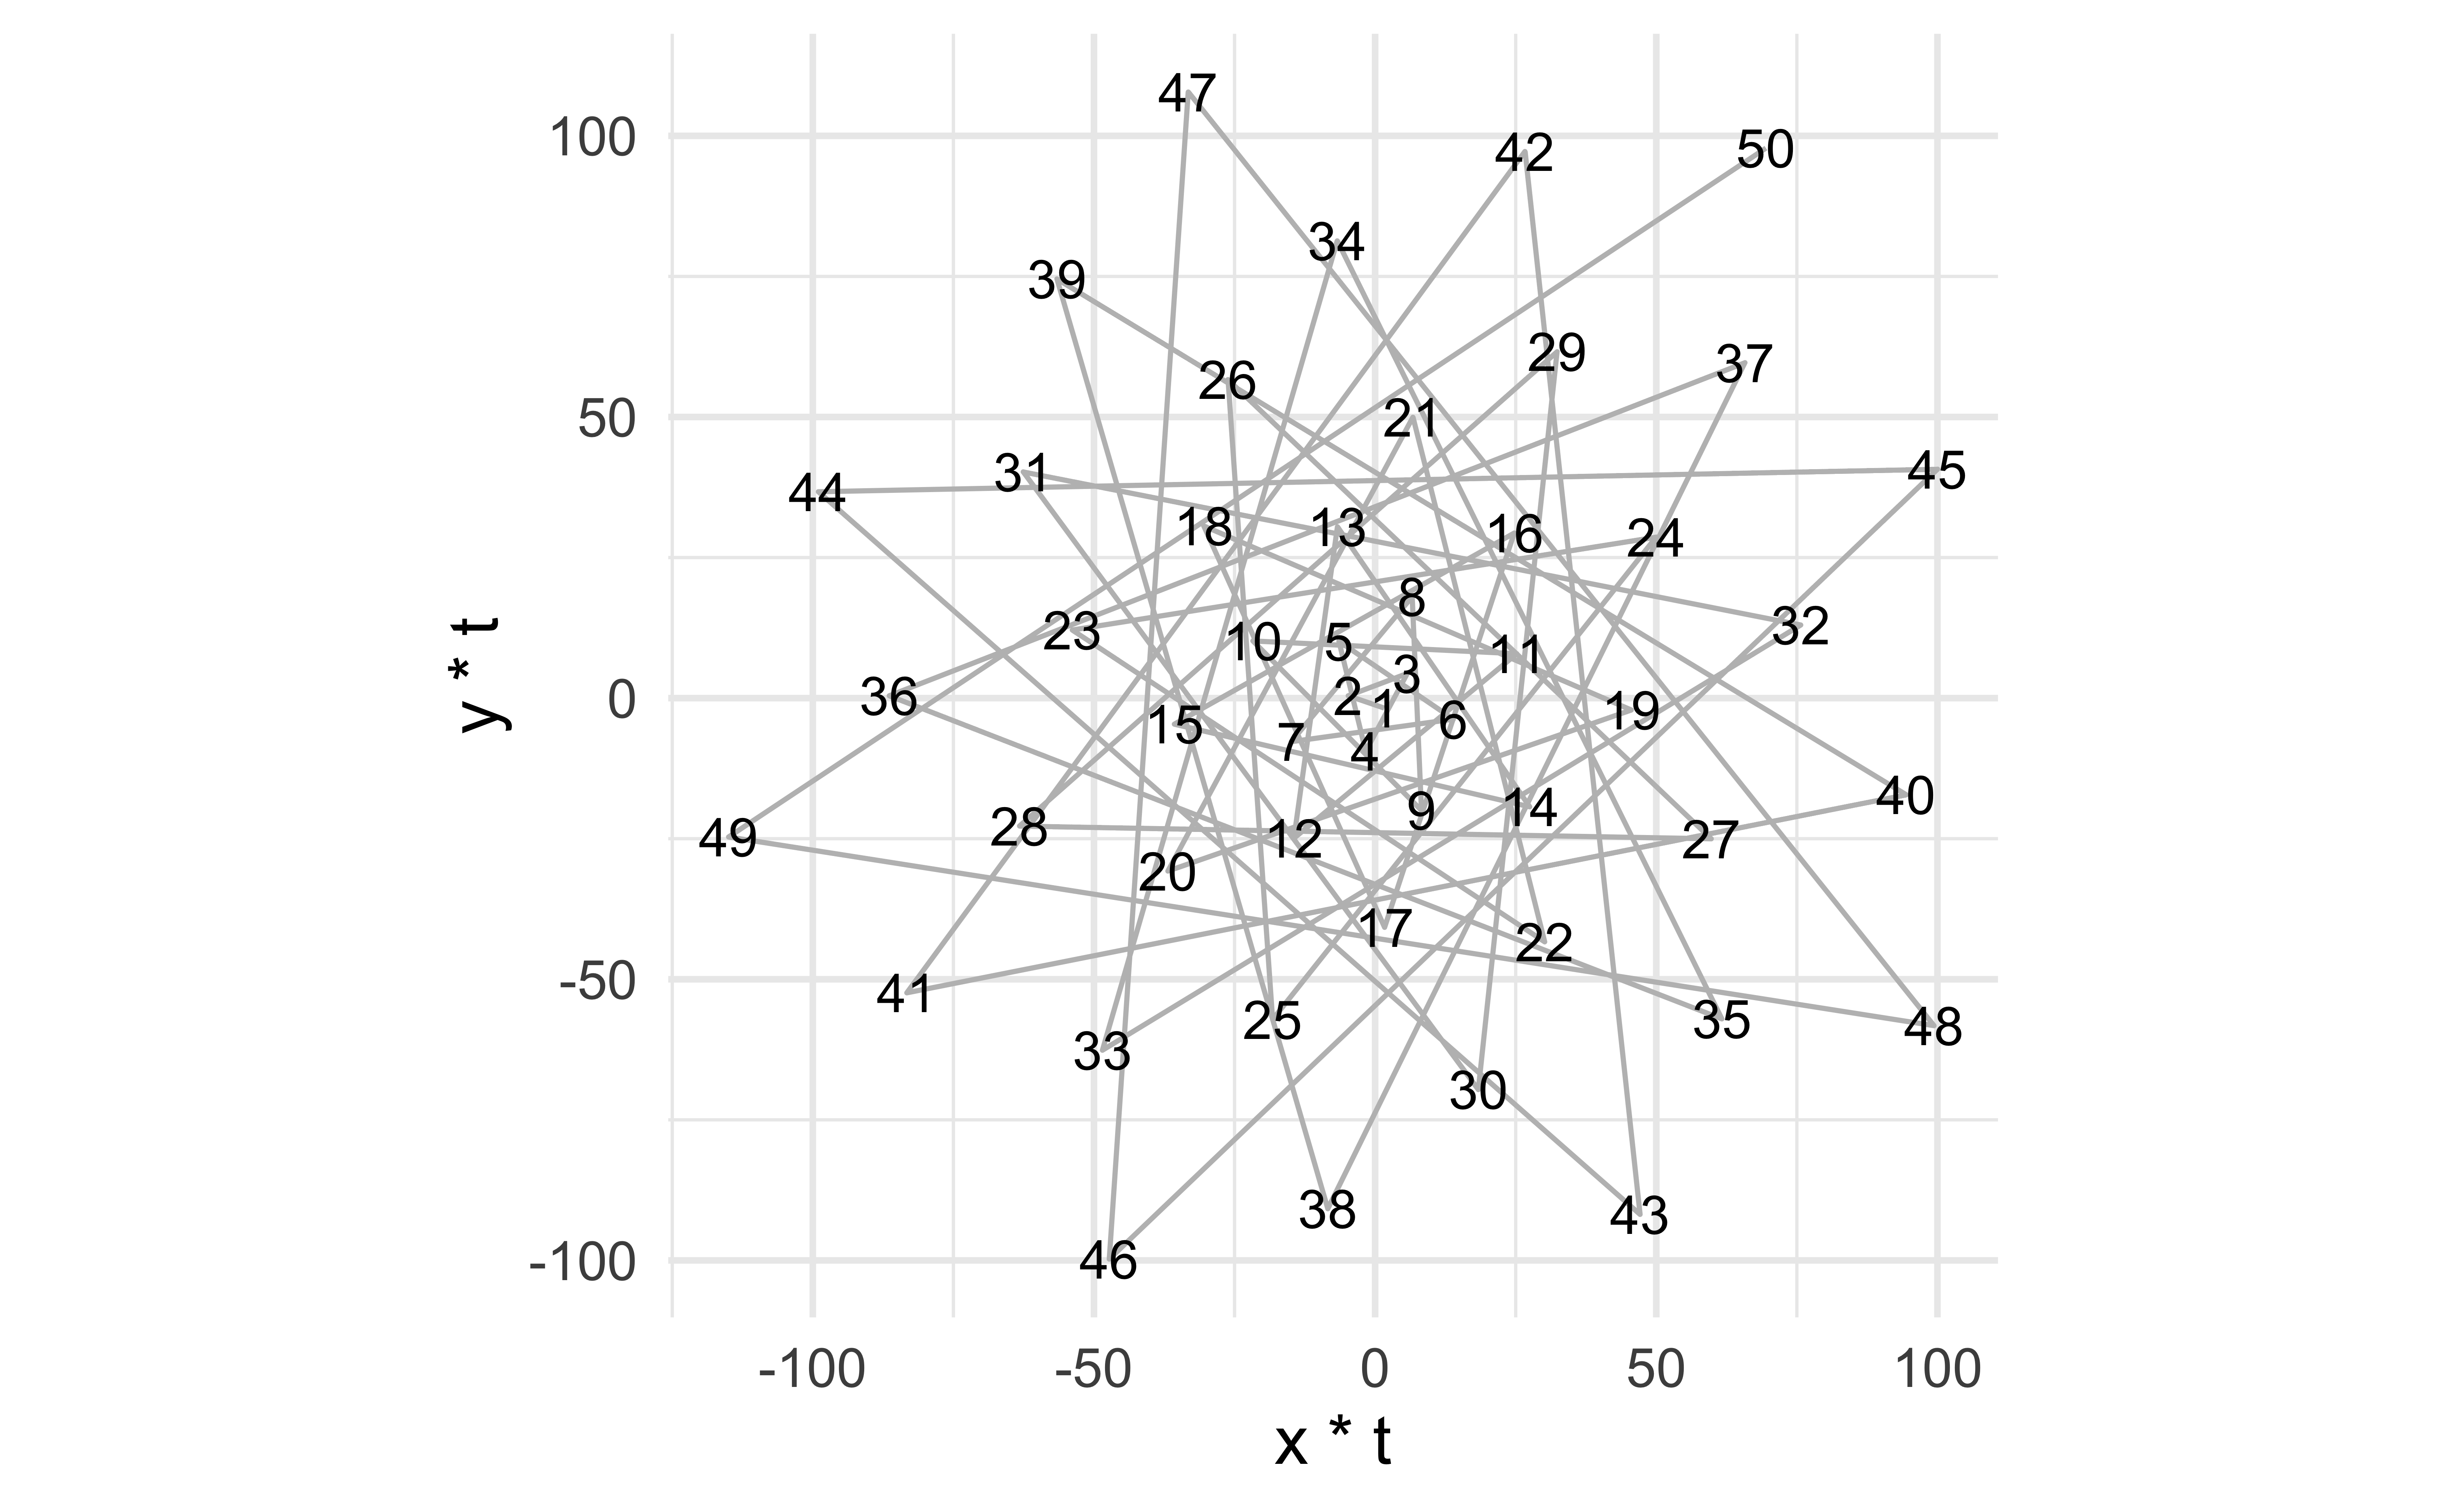
Paths to points
# set golden angle
angle <- pi * (3 - sqrt(5))

# set number of points
points <- 50

# make data frame
df <- tibble(
  i = 1:points,
  t = (1:points) * angle,
  x = sin(t),
  y = cos(t)
)

# plot points in a spiral
ggplot(df, aes(x = x * t, y = y * t)) +
  geom_point() +
  coord_equal()# set golden angle
angle <- pi * (3 - sqrt(5))

# set number of points
points <- 50

# make data frame
df <- tibble(
  i = 1:points,
  t = (1:points) * angle,
  x = sin(t),
  y = cos(t)
)

# plot points in a spiral
ggplot(df, aes(x = x * t, y = y * t)) +
  geom_point() +
  coord_equal()
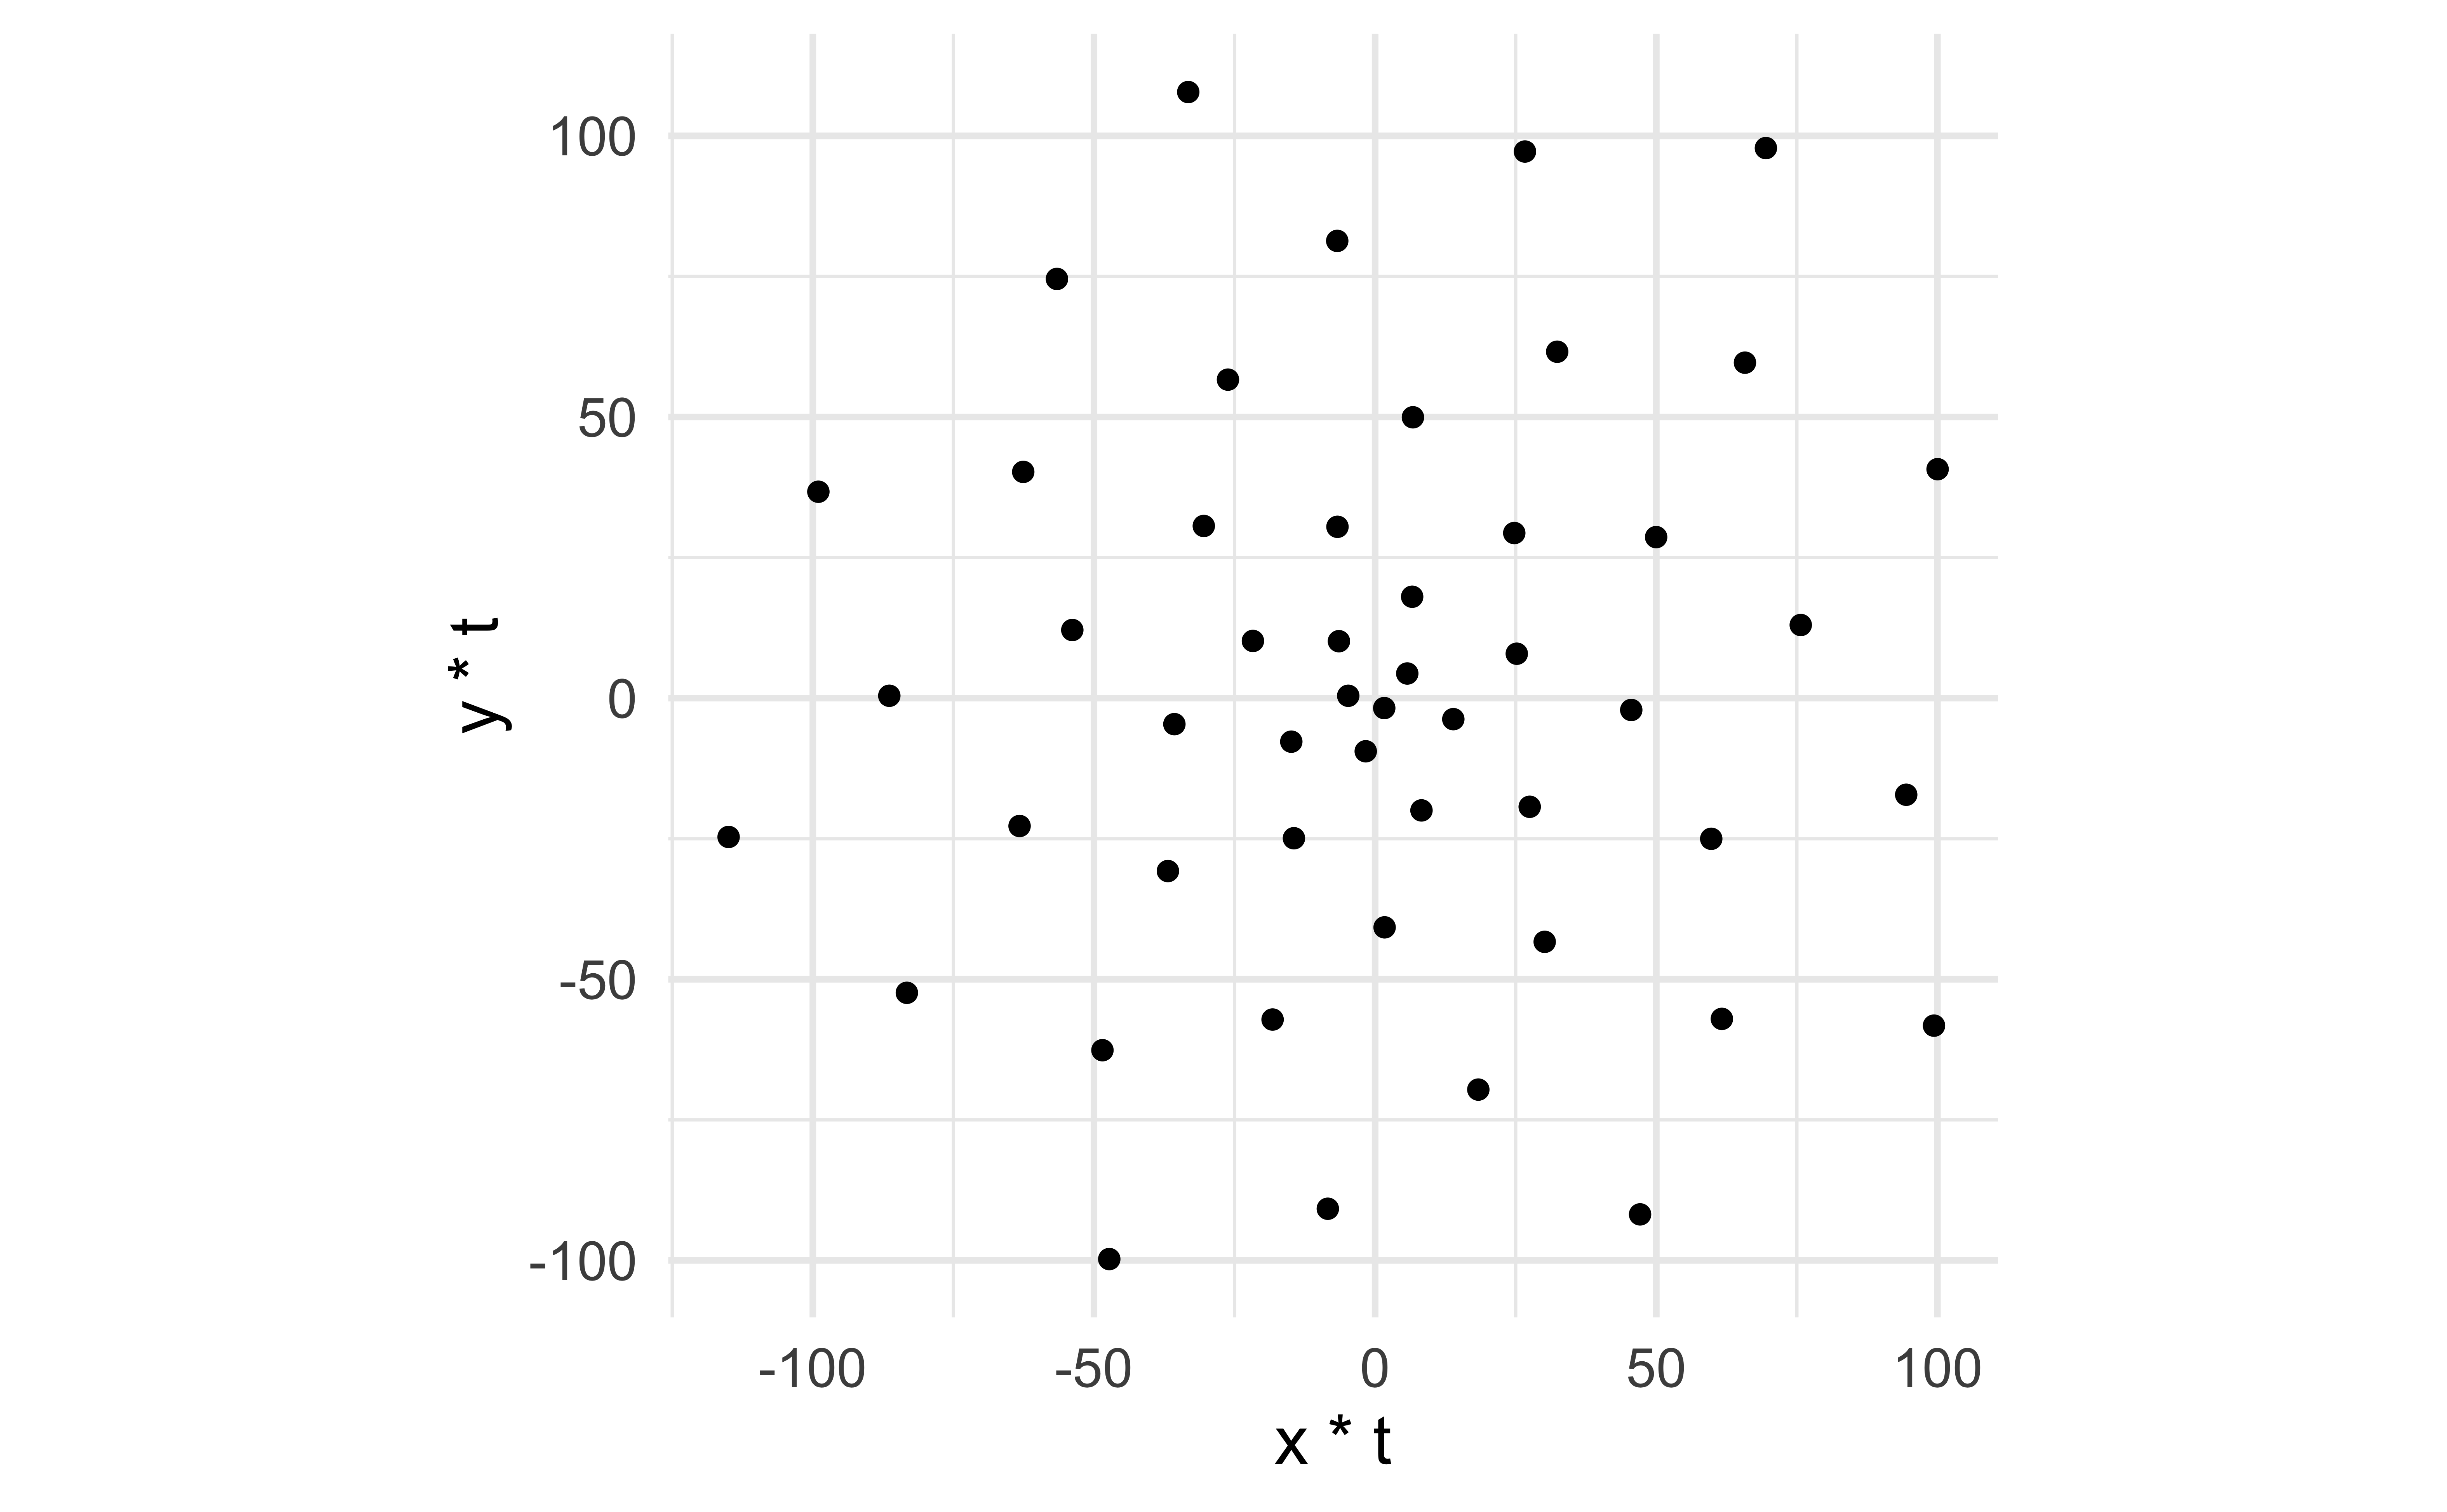
Without the background
# set golden angle
angle <- pi * (3 - sqrt(5))

# set number of points
points <- 50

# make data frame
df <- tibble(
  i = 1:points,
  t = (1:points) * angle,
  x = sin(t),
  y = cos(t)
)

# plot points in a spiral
ggplot(df, aes(x = x * t, y = y * t)) +
  geom_point() +
  coord_equal() +
  theme_void()# set golden angle
angle <- pi * (3 - sqrt(5))

# set number of points
points <- 50

# make data frame
df <- tibble(
  i = 1:points,
  t = (1:points) * angle,
  x = sin(t),
  y = cos(t)
)

# plot points in a spiral
ggplot(df, aes(x = x * t, y = y * t)) +
  geom_point() +
  coord_equal() +
  theme_void()
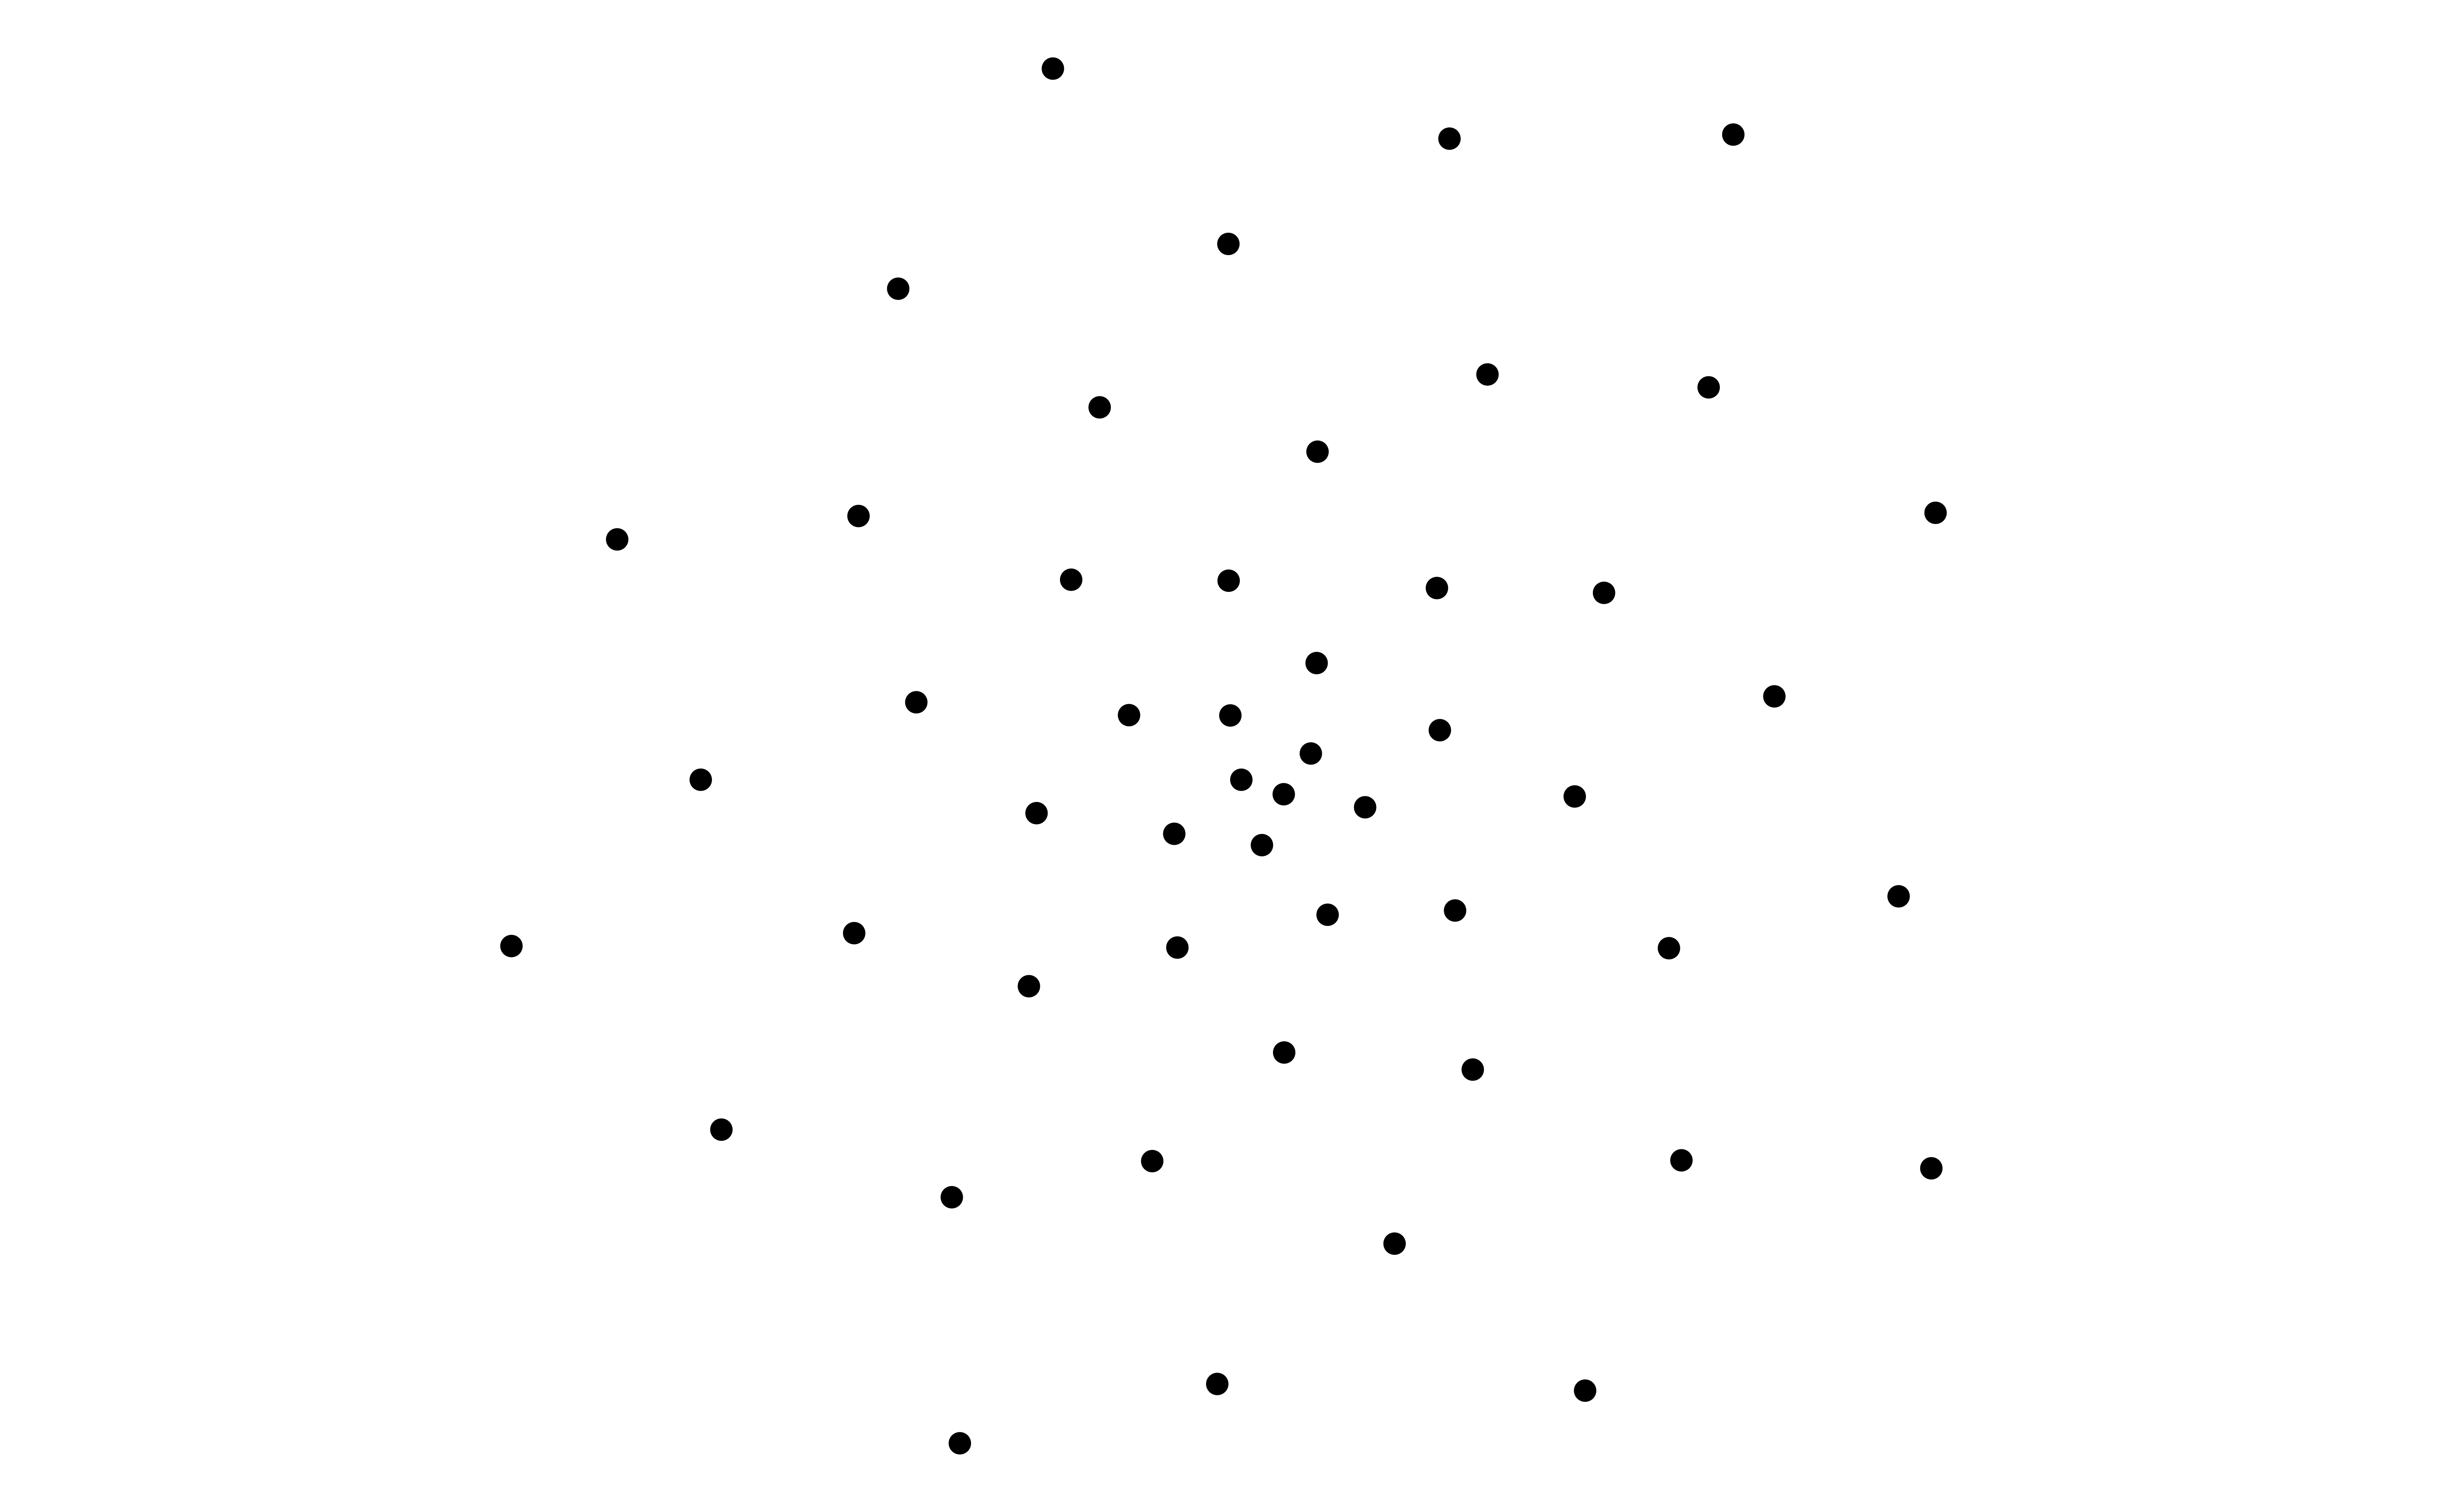
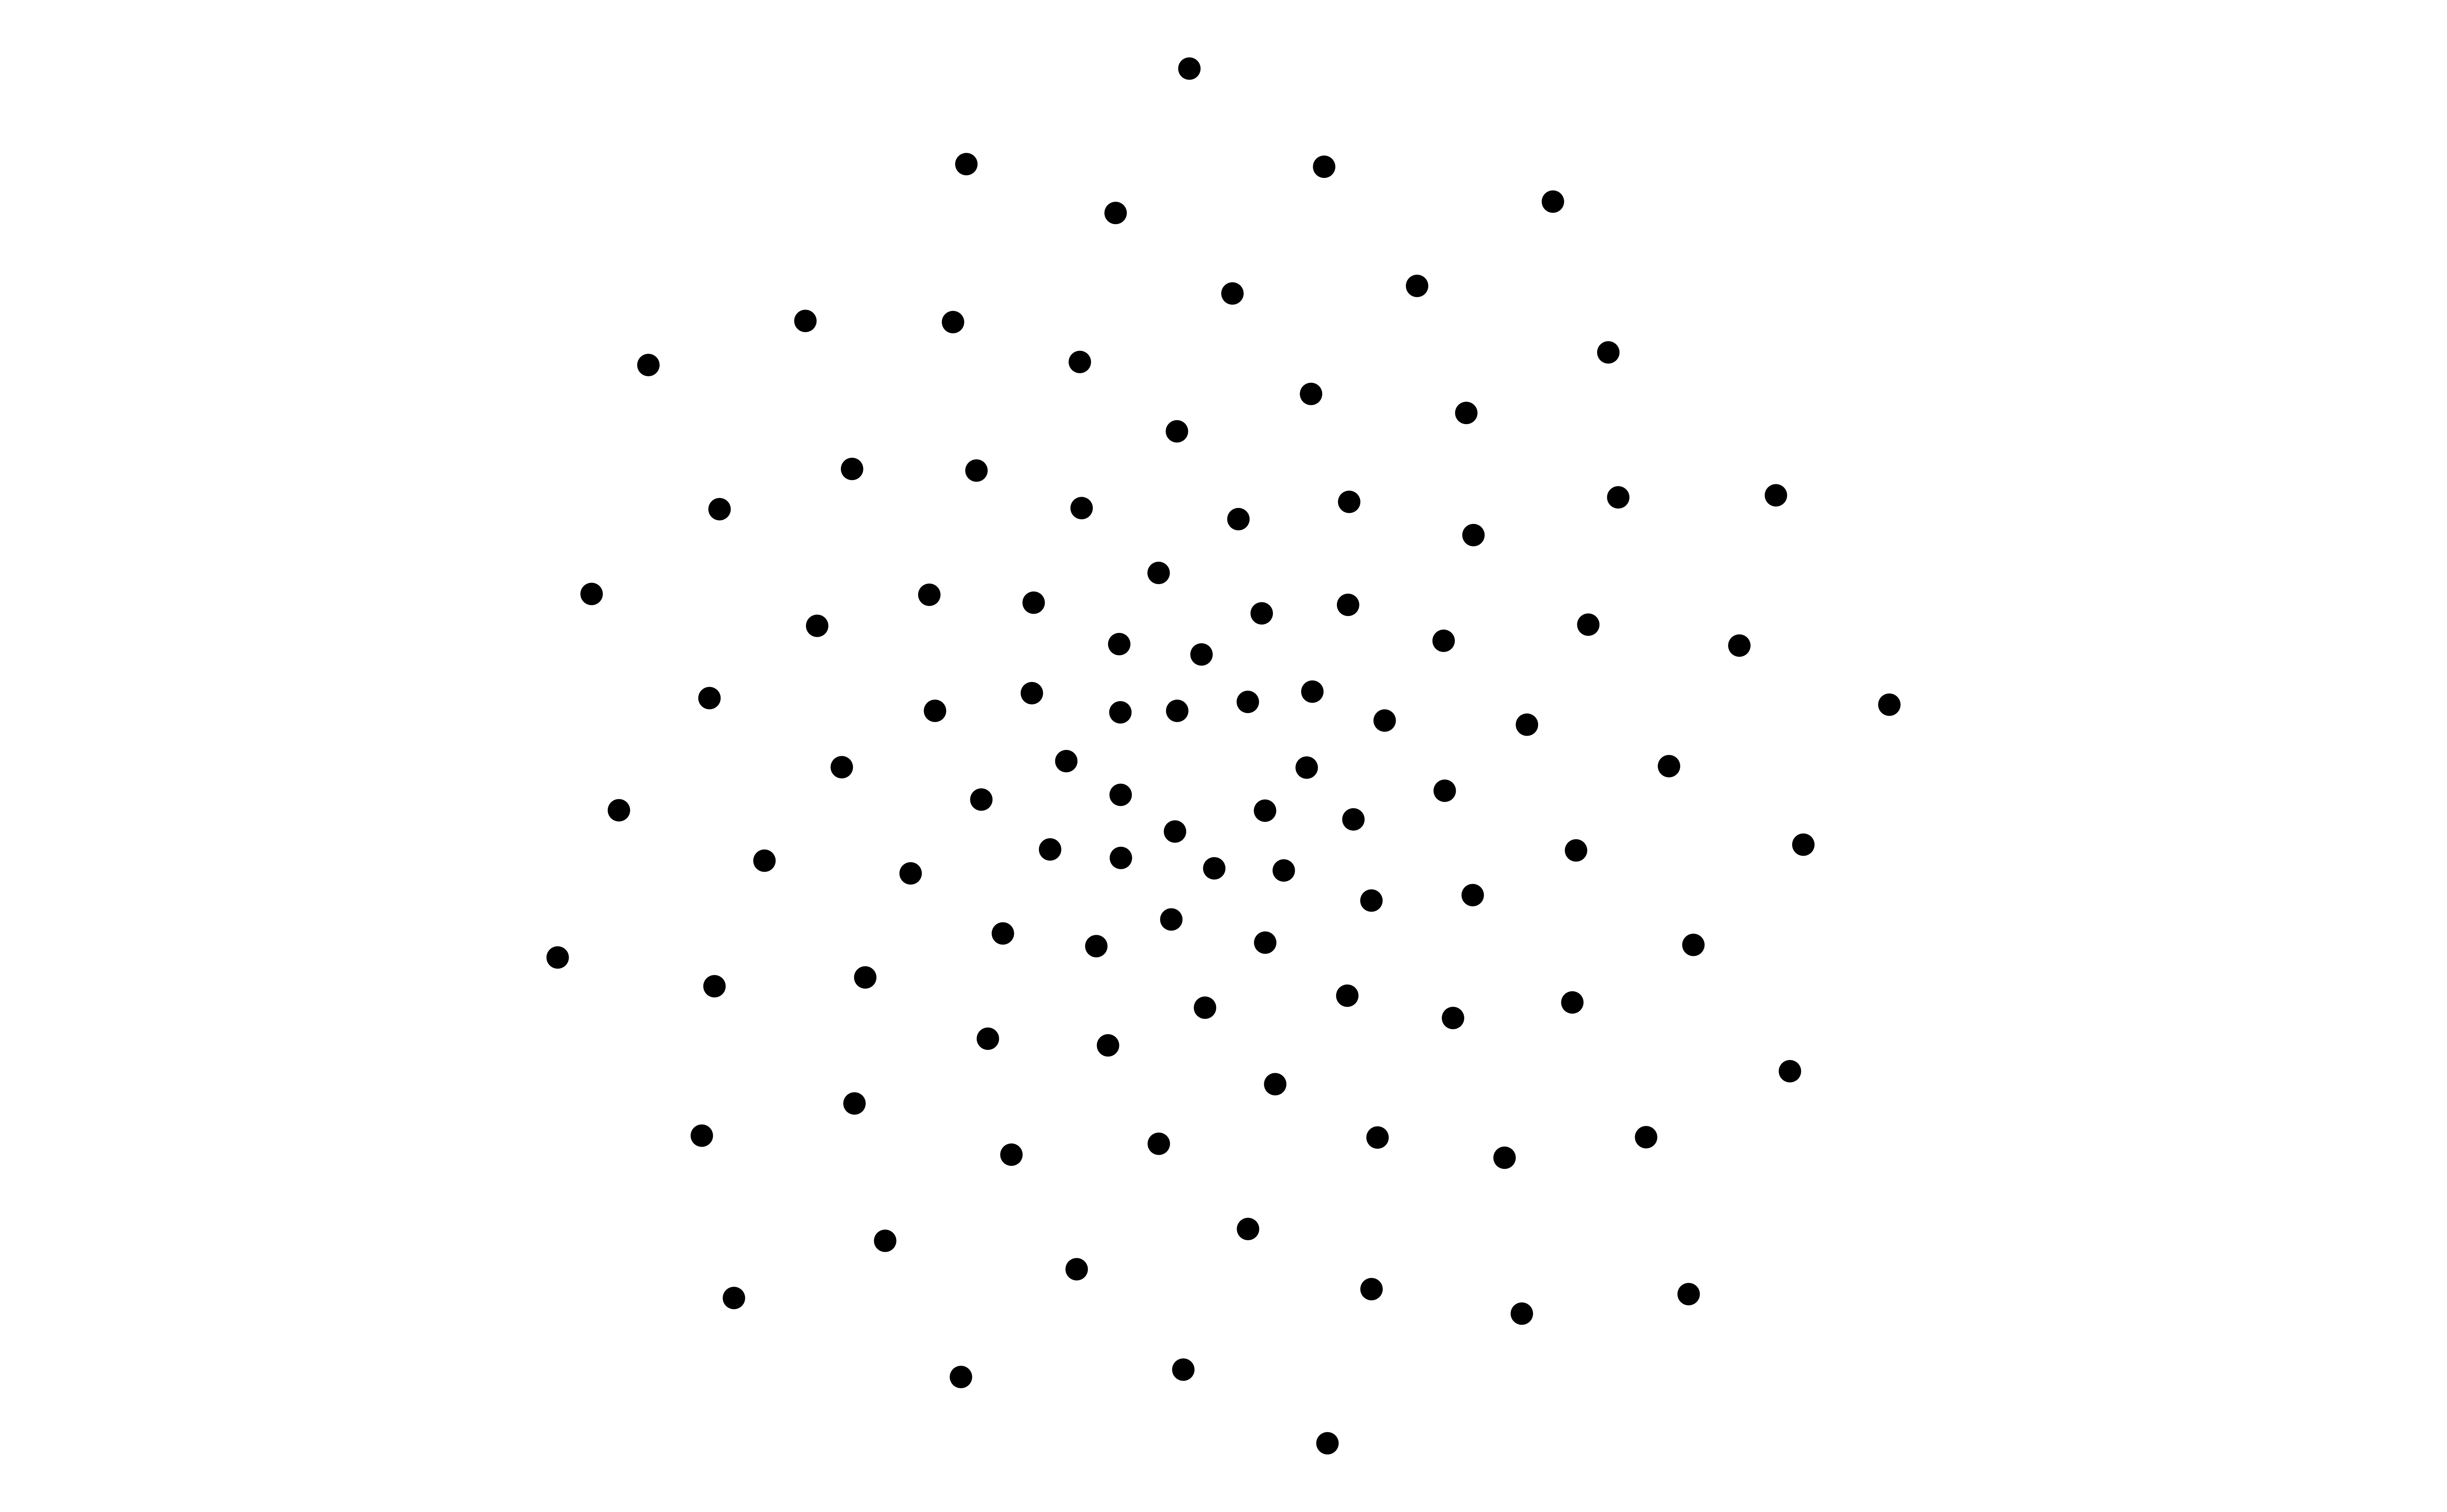
More points
# set golden angle
angle <- pi * (3 - sqrt(5))

# set number of points
points <- 100

# make data frame
df <- tibble(
  i = 1:points,
  t = (1:points) * angle,
  x = sin(t),
  y = cos(t)
)

# plot points in a spiral
ggplot(df, aes(x = x * t, y = y * t)) +
  geom_point() +
  coord_equal() +
  theme_void()# set golden angle
angle <- pi * (3 - sqrt(5))

# set number of points
points <- 100

# make data frame
df <- tibble(
  i = 1:points,
  t = (1:points) * angle,
  x = sin(t),
  y = cos(t)
)

# plot points in a spiral
ggplot(df, aes(x = x * t, y = y * t)) +
  geom_point() +
  coord_equal() +
  theme_void()
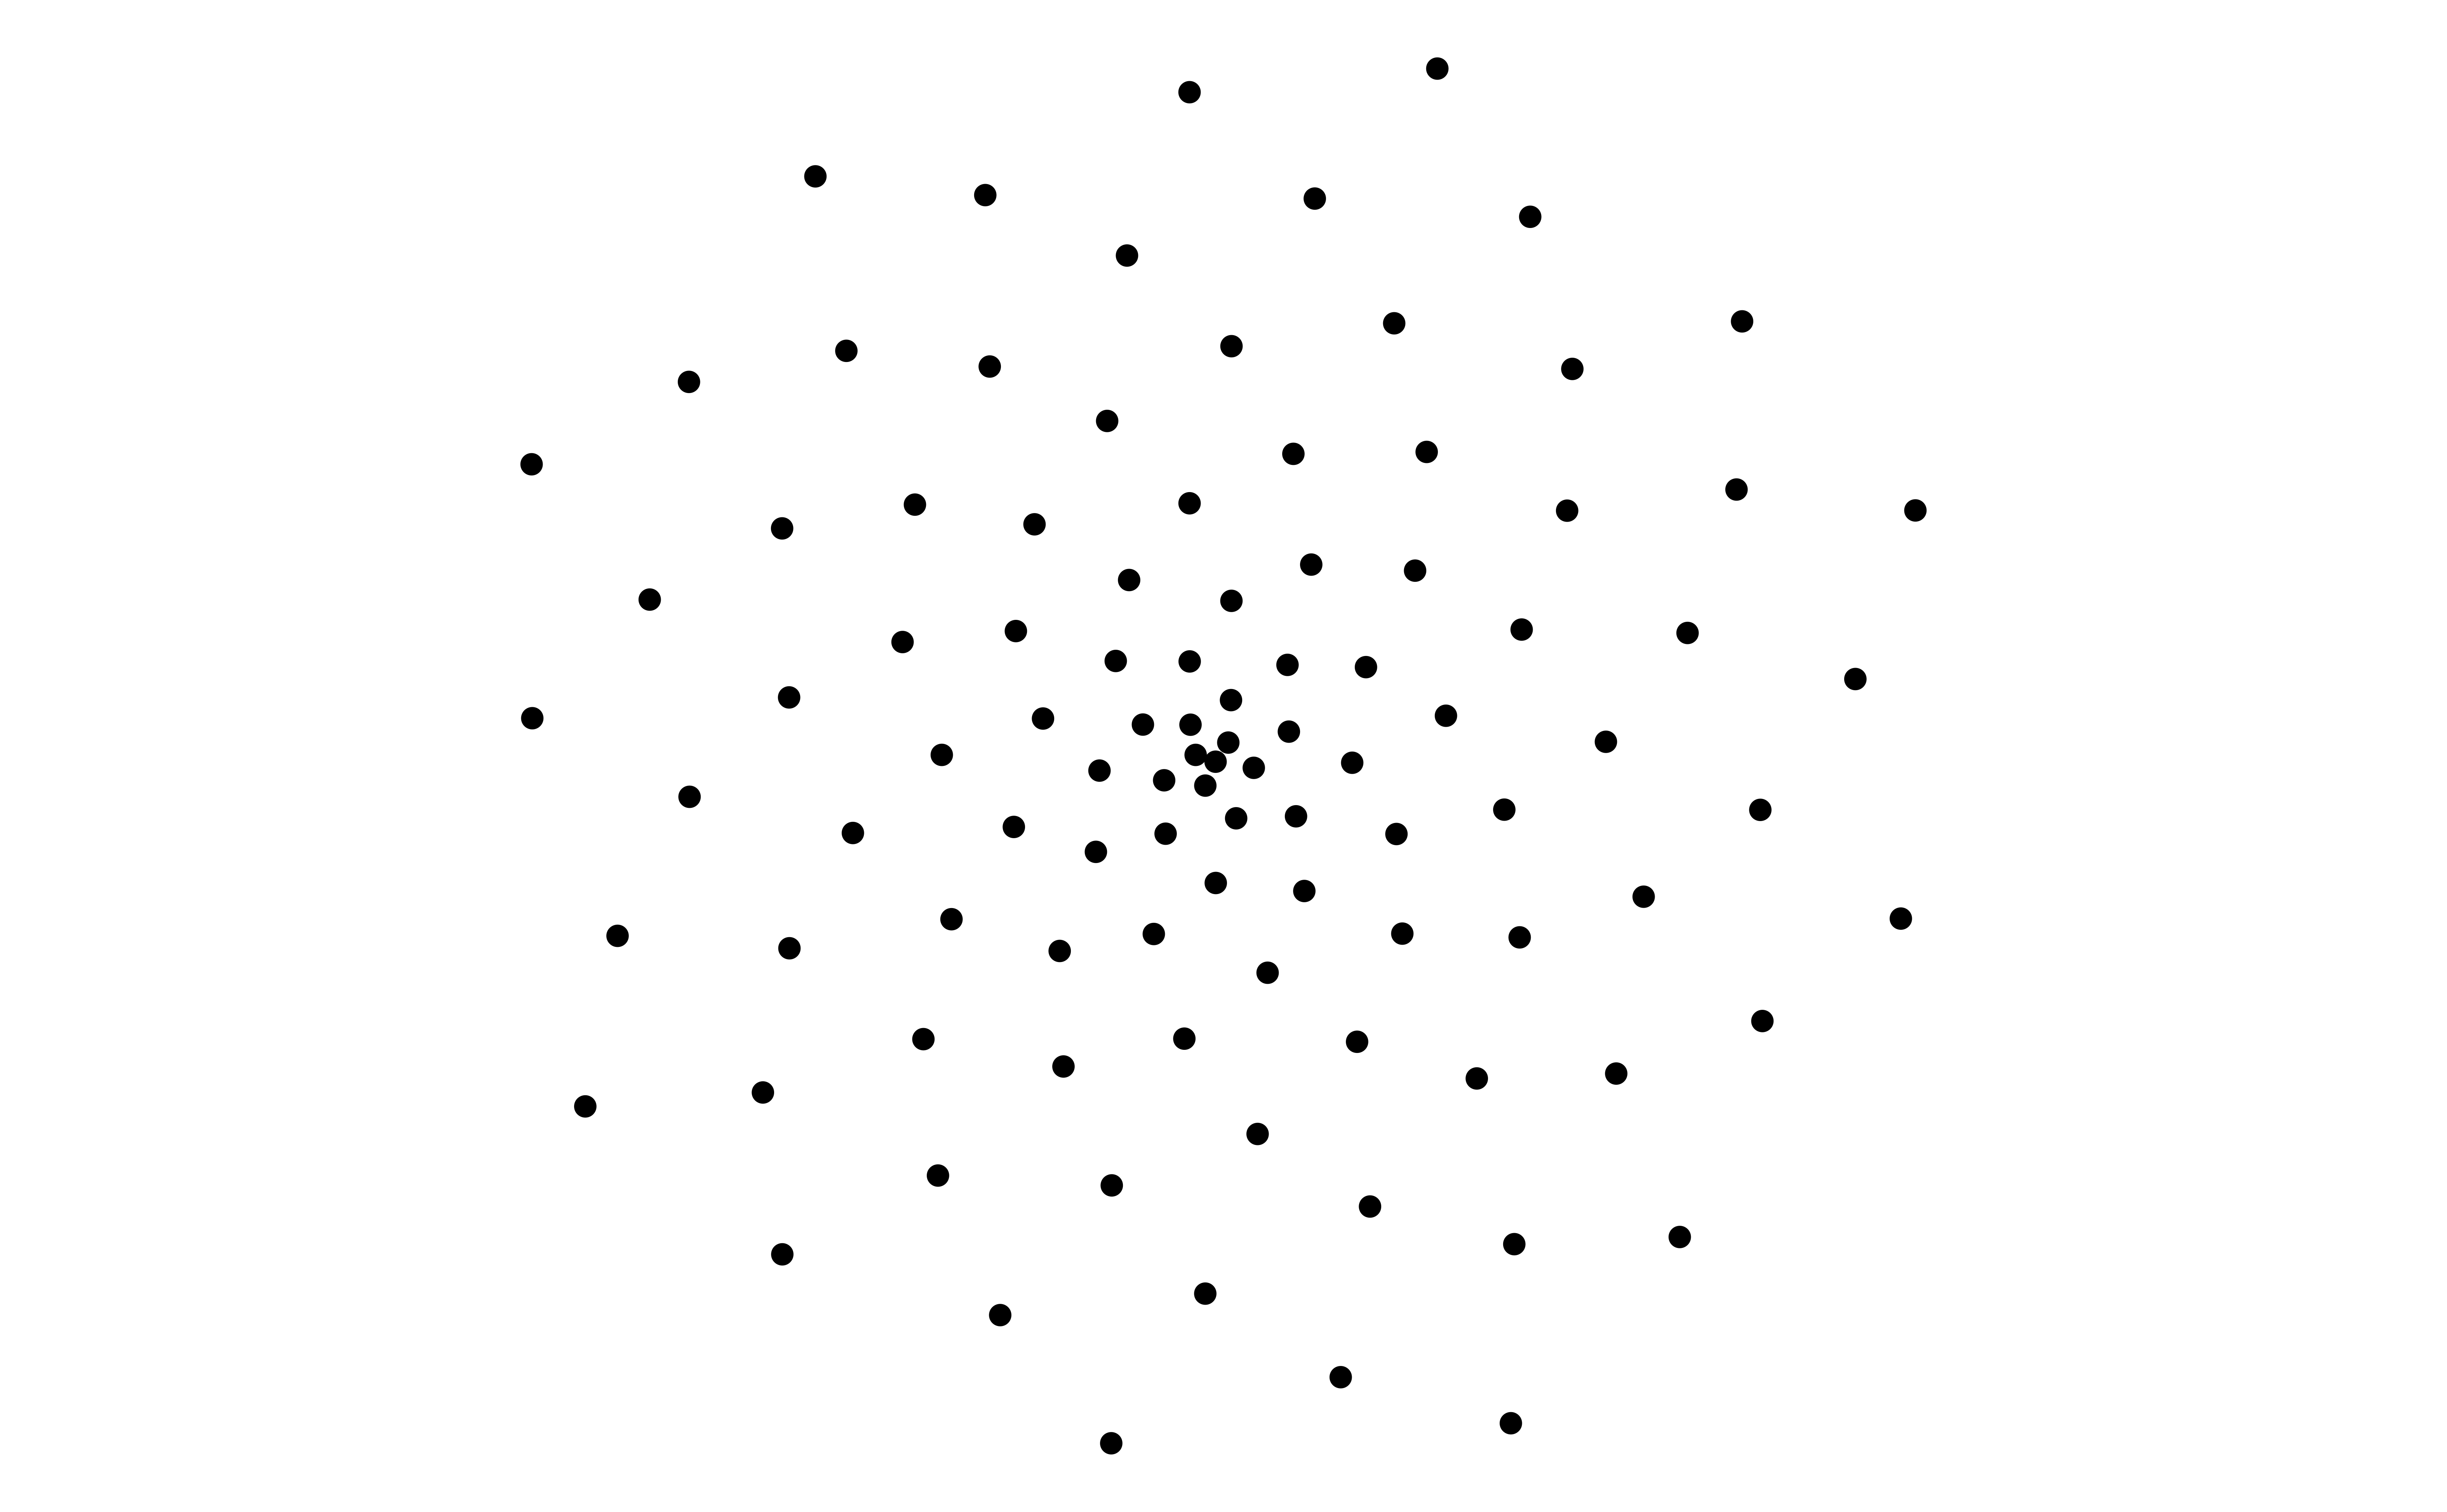
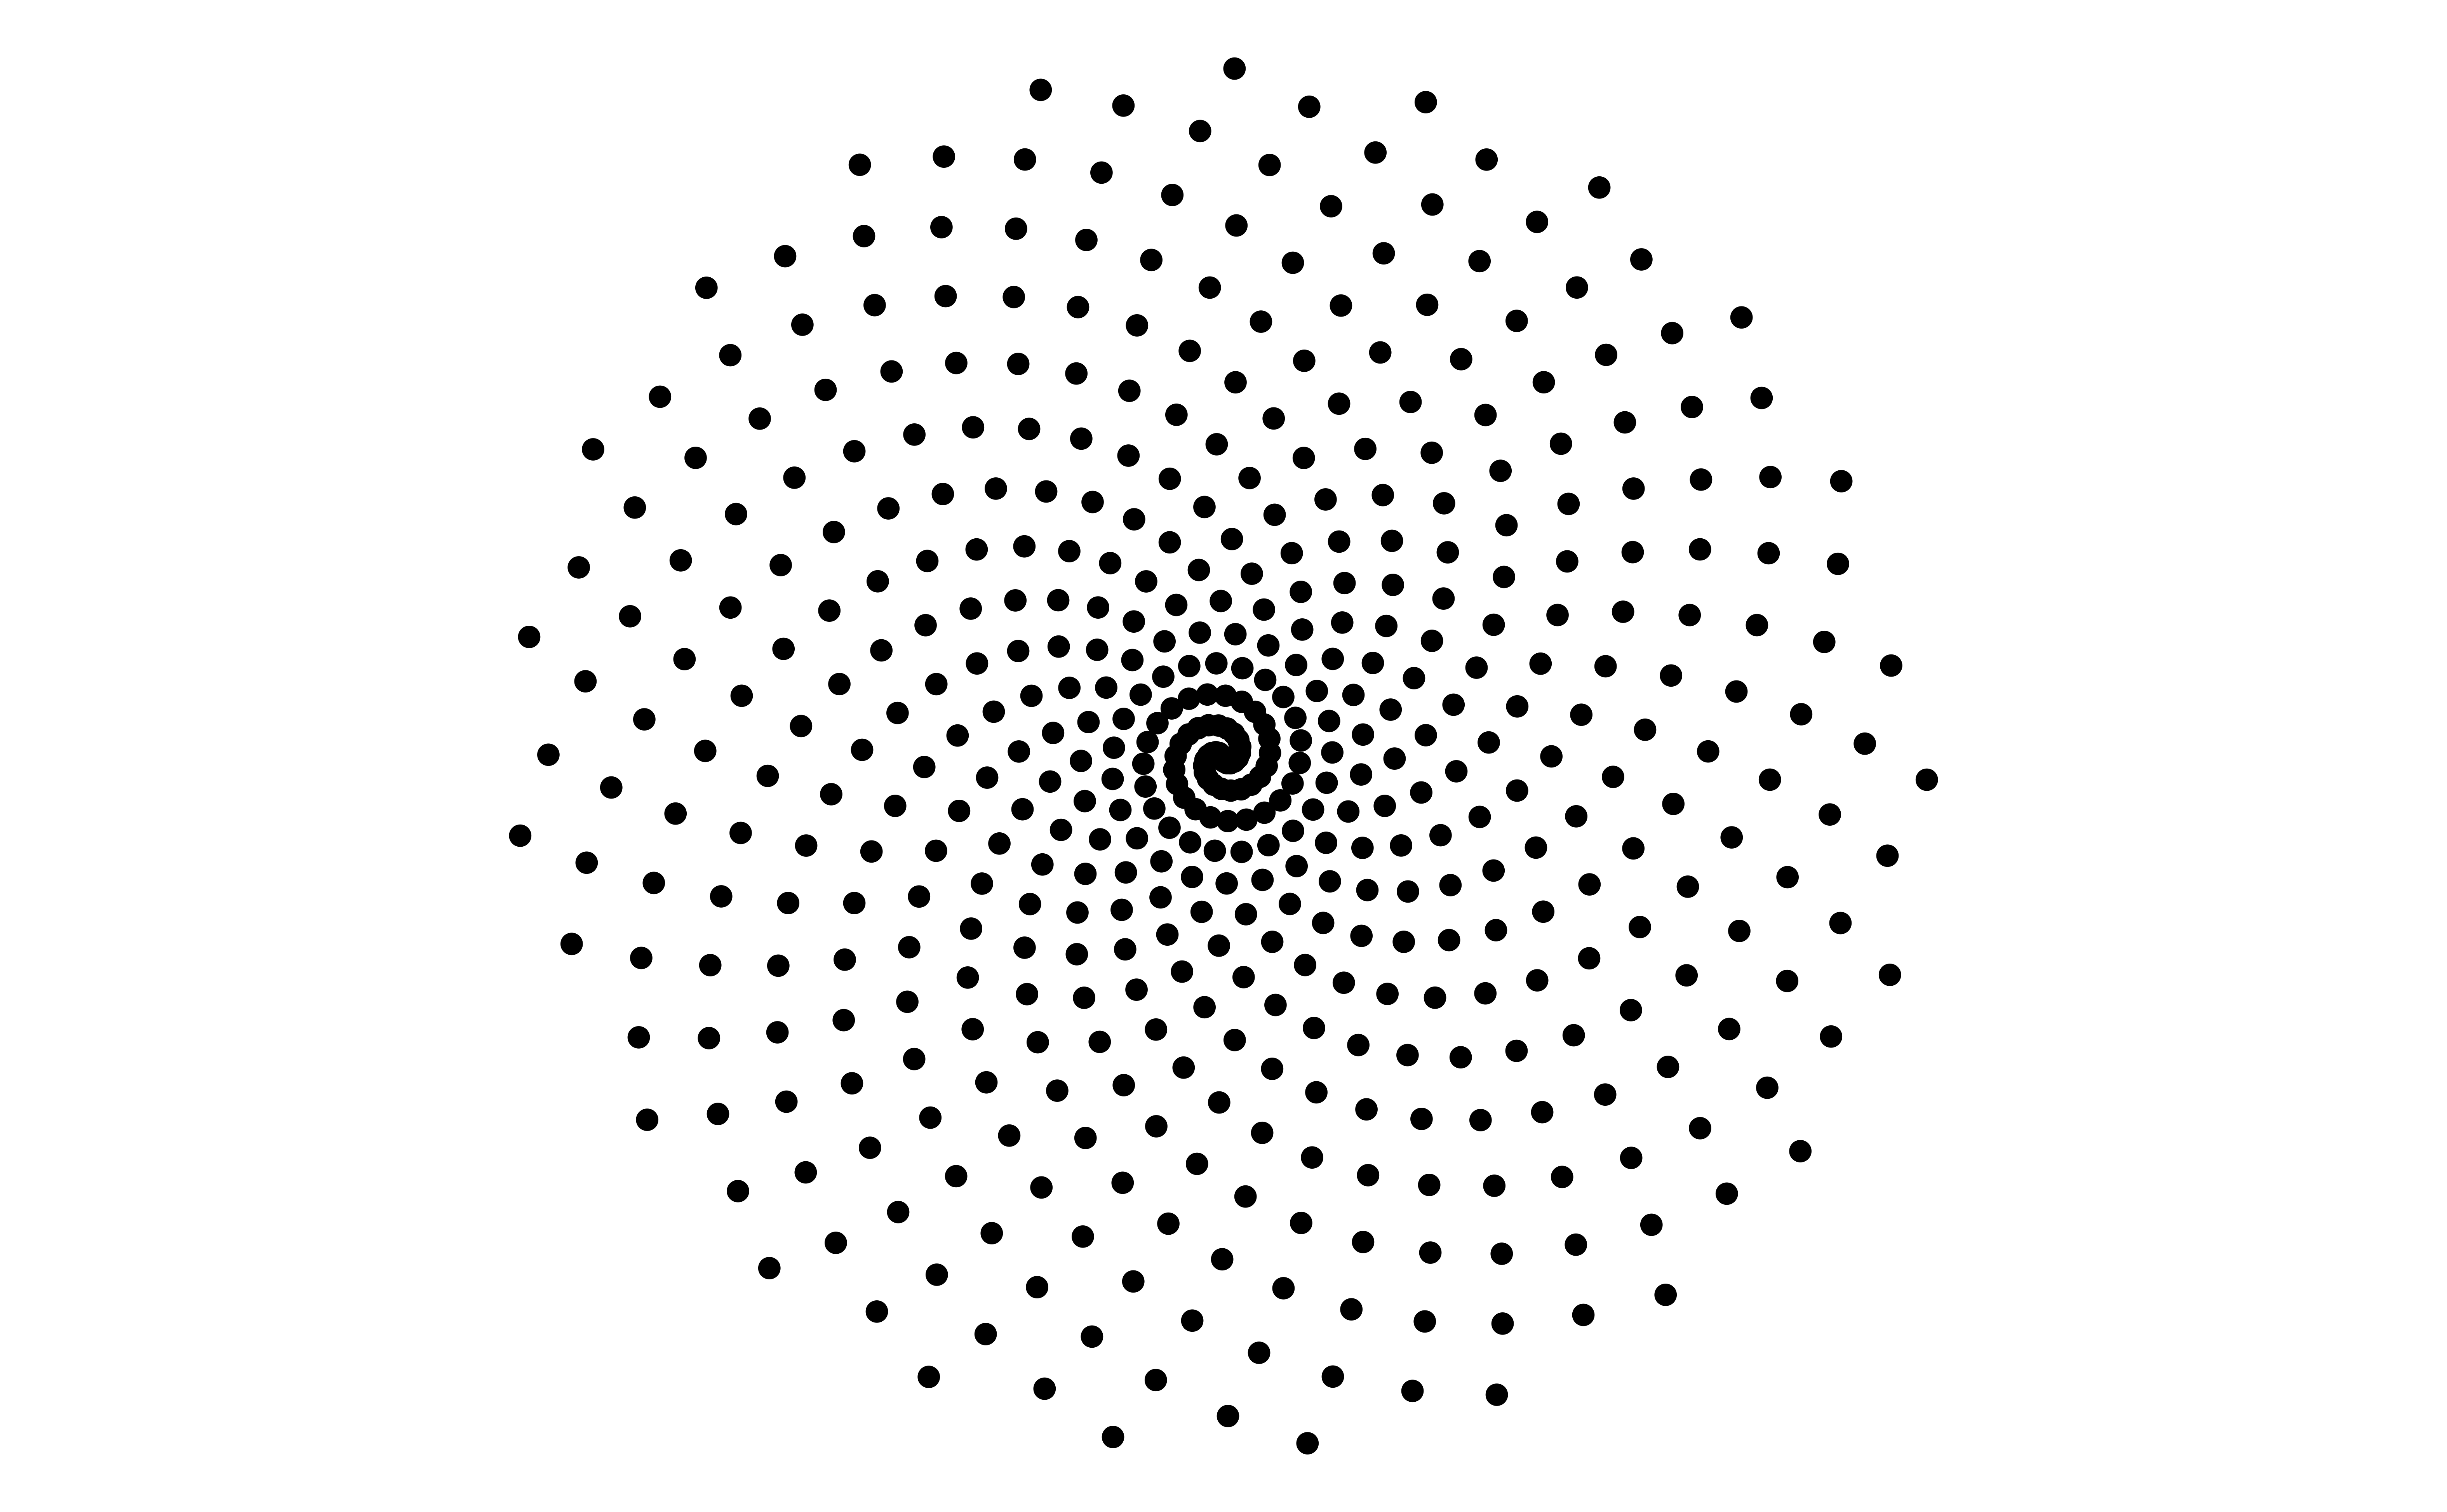
Adjust points
# set golden angle
angle <- pi * (3 - sqrt(5))

# set number of points
points <- 100

# make data frame
df <- tibble(
  i = 1:points,
  t = (1:points) * angle + 20,
  x = sin(t),
  y = cos(t)
)

# plot points in a spiral
ggplot(df, aes(x = x * t, y = y * t)) +
  geom_point() +
  coord_equal() +
  theme_void()# set golden angle
angle <- pi * (3 - sqrt(5))

# set number of points
points <- 100

# make data frame
df <- tibble(
  i = 1:points,
  t = (1:points) * angle + 20,
  x = sin(t),
  y = cos(t)
)

# plot points in a spiral
ggplot(df, aes(x = x * t, y = y * t)) +
  geom_point() +
  coord_equal() +
  theme_void()
Formalize a system
Write a function: build_art()
Add arguments to build_art()
# A tibble: 100 × 4
       i     t       x       y
   <int> <dbl>   <dbl>   <dbl>
 1     1  22.4 -0.398  -0.918
 2     2  24.8 -0.327   0.945
 3     3  27.2  0.879  -0.476
 4     4  29.6 -0.970  -0.243
 5     5  32.0  0.551   0.834
 6     6  34.4  0.157  -0.988
 7     7  36.8 -0.783   0.622
 8     8  39.2  0.998   0.0701
 9     9  41.6 -0.688  -0.726
10    10  44.0  0.0173  1.00
# ℹ 90 more rows
Use the function
Change parameters
Next steps…
- Add random noise
- Add more customization options
- Size
- Color
- Shape
- …
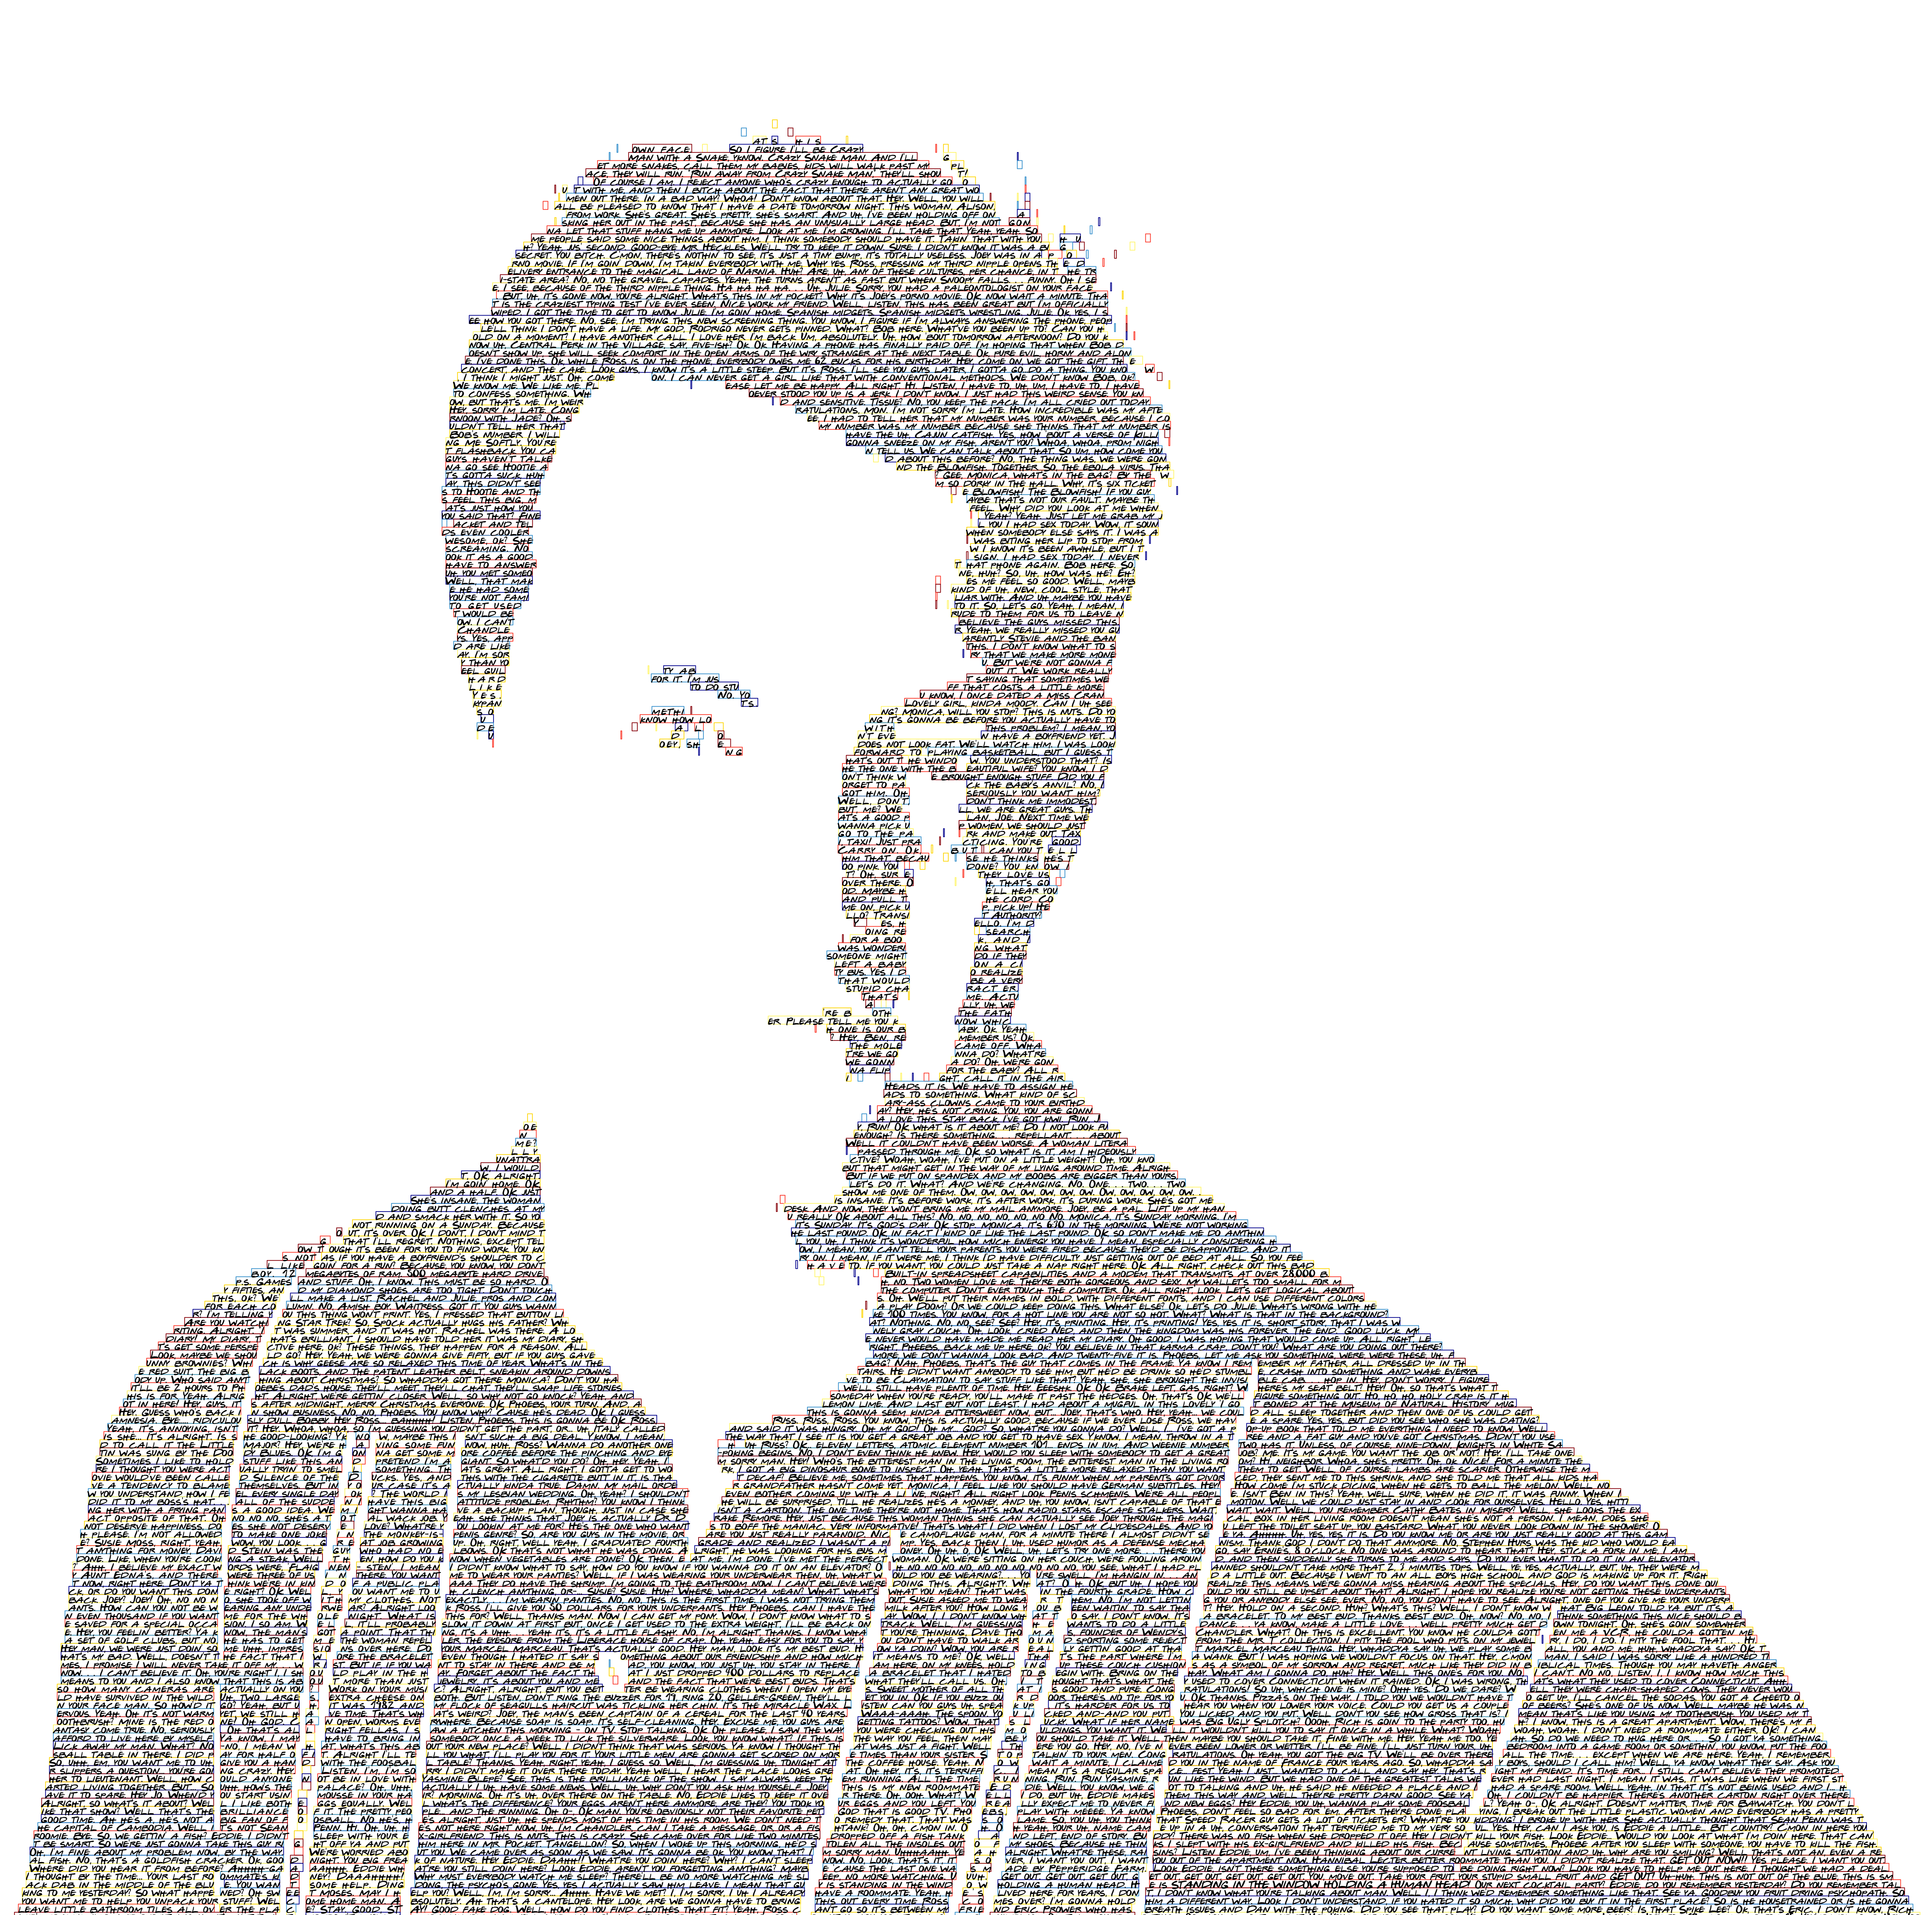
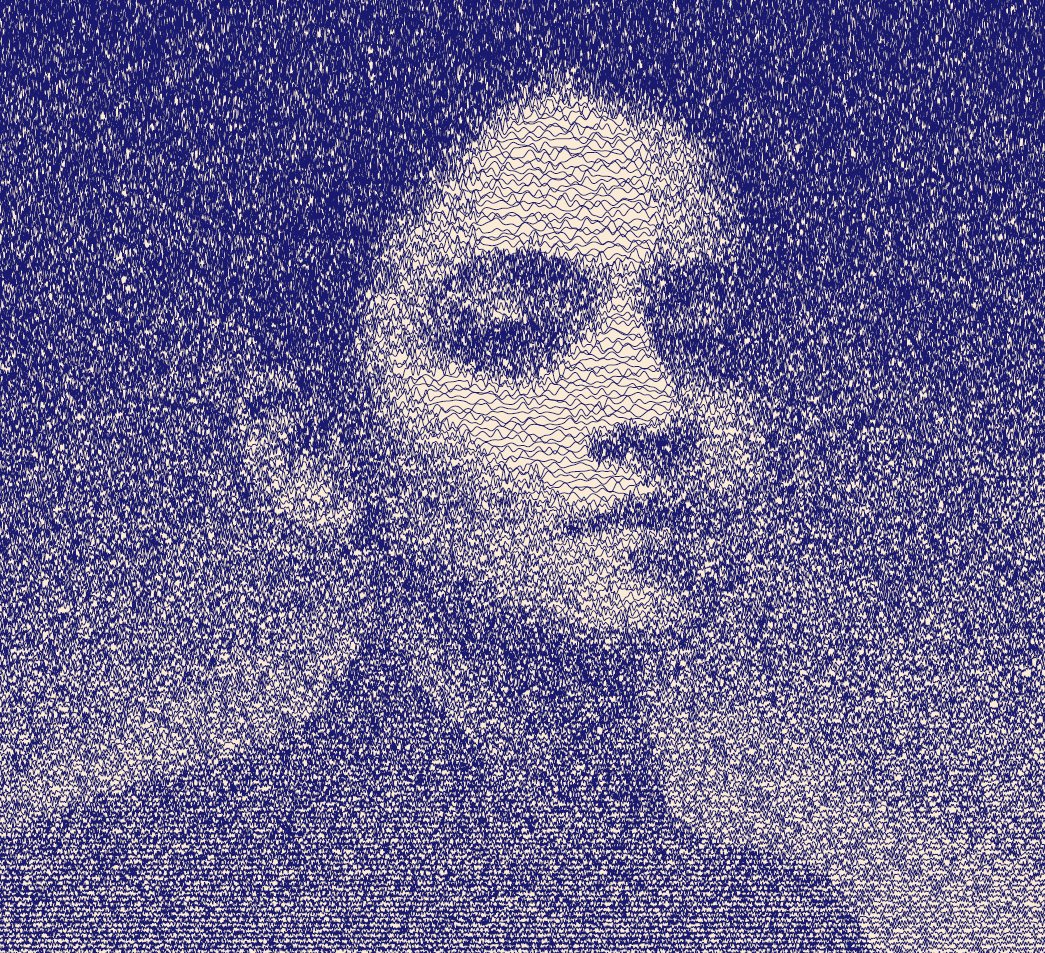
Writing over images

Wrap up
Acknowledgements
Unpredictable paintings by Danielle Navarro
Drawing Flowers with R and ggplot2 by Amanda Rowe
Generative Art and R by the Generative Arts Collective
Why Love Generative Art? by Jason Bailey
Learn/do more
R packages:
More aRtists: rtistry art gallery by Ijeamaka Anyene
A whole course on Generative Art by Danielle Navarro: https://art-from-code.netlify.app


